|
These free reports, twice a month, are
useful, but to successfully trade market
trends you need our daily reports. At
half price they are an affordable and
valuable tool for creating profits in
the stock market.
Special
HALF PRICE Offer ---> CLICK
HERE NOW
S&P
500 Index (SPX) Chart Analysis
Last week:
"This "death-cross" pattern
occurred weeks ago in the Russell 2000
Small Cap Index (RUT) and this week
in the Nasdaq 100 Index (NDX) charts."
This week:
Is a recession in the future? Hard to
ignore that possibility considering the
obvious stock market warnings. The stock
market looks ahead and today's prices
reflect what traders expect to happen
in future months.
The bearish patterns are increasing every
week.
Last week we added another bearish pattern
to the list. The extreme volatility over
the past weeks have created a pennant
pattern. This occurs when your rallies
reach lower highs and declines reach higher
lows.
This pattern, drawn on the below daily
chart of the SPX, is bearish if it occurs
after a downtrend. Typically, in this
scenario, the pattern breaks lower and
there are further losses.
On Friday of this week that pattern was
broken to the downside.
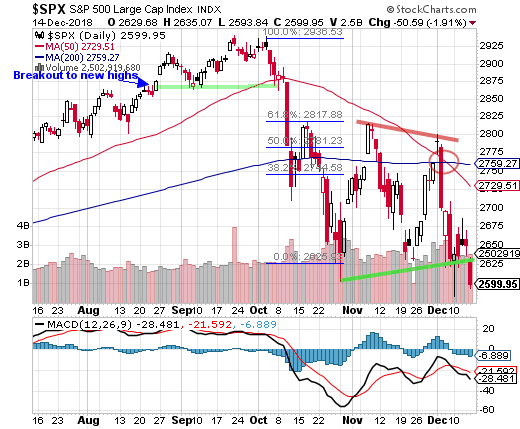
The other bearish patterns are:
A bearish divergence in the latest two
SPX highs on the daily chart and MACD
which did not make new highs.
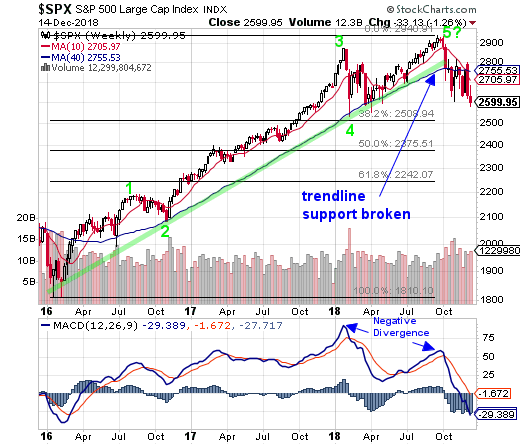
There is a five wave pattern (Elliott
Wave) that ended in early October. If
this pattern has completed we are looking
at a decline, potentially, to SPX 2242.
The two-year long trend support line
has been broken.
The so-called death-cross pattern has
now appeared on all the major index charts.
|
Fibtimer HALF
PRICE Offer!
Get
Our Full Reports
Every Weekend
plus Updates Every Trading Day
These FREE reports
are great, but getting our timing signals daily is
what you need to beat the market!
only
$12.25 monthly for
full year
Bull & Bear
Timer
10 Year Results
Fibtimer Timing + 284.2 % |
3
Year Results
Fibtimer Timing + 65.8 %
|
Sleepless
nights as your investments are
consumed by a volatile Wall Street?
Consider Fibtimer's
trend trading services. Our trading
plans are unemotional and are always
invested with the trend,
which ever way it is headed.
Fibtimer's
timing strategies MAKE
MONEY in BOTH advancing & declining
markets. No more sleepless nights.
No more upset stomachs.
We profit year after year after year. In fact, we have been timing
the markets successfully for over 25 years.
Join us and start winning!
We
are currently offering HALF
PRICE to new and returning
subscribers.
--- only
$12.25 monthly for full year
Special
HALF PRICE Offer - CLICK
HERE NOW
|
|
On Monday of this week the SPX rallied
into the close, ending the day in positive
territory, but the advances / declines
were terrible. Advancing stocks were
973 vs declining 2026. That by itself
was a warning that this week was going
to see losses.
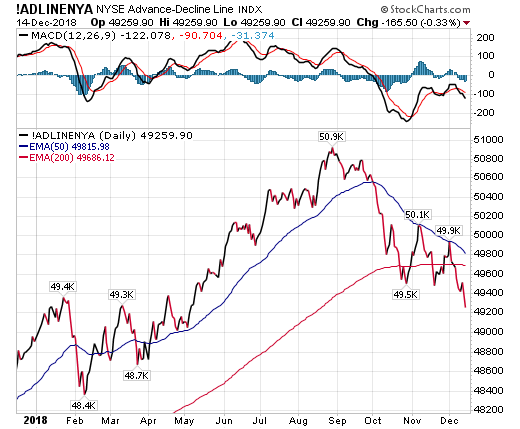
The Advance-Decline Line for the NYSE
Composite Index closed at new lows this
week.
The A-D line has now reached its 50-day
average line twice and both times reversed
and turned lower.
Ominously the A-D line closed below
its 200-day average line "again" this
week.
The A-D line also closed at "new" lows.
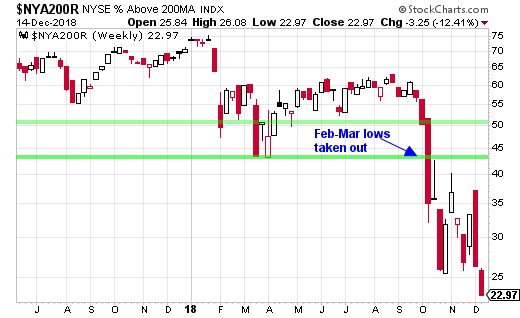
If you think breadth is bad in the above
A-D chart, look at the below chart of
the stocks in the NYSE (1600 issues)
that are "below" their 200-day
moving average line.
77.03% of stocks in the NYSE are trading
below their 200-day average lines
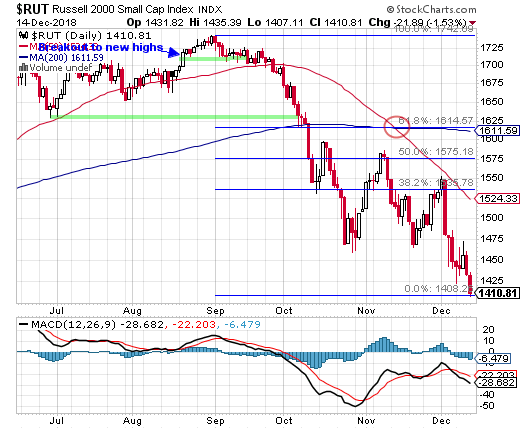
Look at small caps. They Russell 2000
Small Cap Index (RUT) has now lost -19.1%
since it hit new bull market highs in
the end of August.
And again this index broke down to new
lows this week.
Technically a bear market begins when
declines reach 20%. That is only 0.9%
further on this daily chart of small
caps.
We would have to say that small caps
are already deep into a bear market.
The 20% rule is fine but this chart is
extremely ugly.
Regularly
Followed Weekly Charts
NYSE Advance-Decline
Line
The NYSE A-D Line is not only below
its 200-day line but this week reached
a new low.
MACD has posted a bearish crossover
and remains in bearish territory for
the first time since March.
The A-D line reached its 50-day average
line twice in the past month during extreme
rallies. Both times it immediately reversed
lower.
Note that on each rally the A-D line
reached lower highs and on each decline
has reached lower lows.
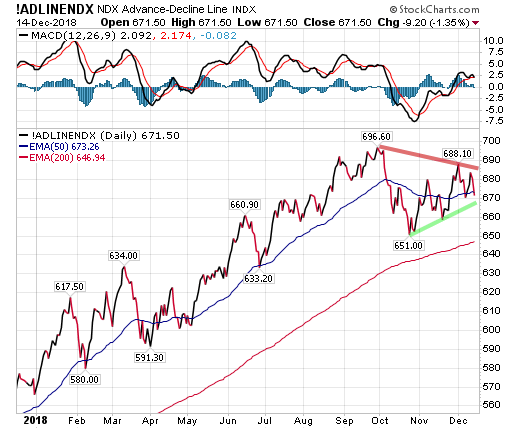
The Nasdaq 100 Index Advance-Decline Line continues to do much better than
the NYSE A-D Line. MACD has crossed into bullish territory.
The Nasdaq 100 Index (NDX) itself is
one of the few major indexes that did
not make a new low this week. Though
it is trading at its lows.
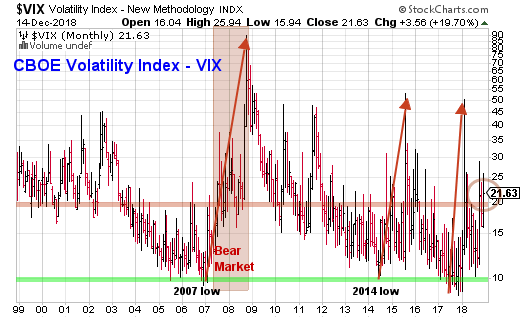
CBOE Volatility
Index (VIX)
The CBOE Volatility Index (VIX) is back
above the red line set at VIX 20.0.
|
Fibtimer HALF
PRICE Offer!
Get
Our Full Reports
Every Weekend
plus Updates
Every Trading
Day
These
FREE reports are NOT enough
Receive our reports in Real-Time!
only
$12.25 monthly
Available
this Weekend
Bull & Bear
Timer
10 Year Results
Fibtimer Timing + 284.2 % |
3
Year Results
Fibtimer Timing + 65.8 %
|
Sleepless
nights as your
investments are
consumed by a volatile
Wall Street?
Consider Fibtimer's
trend trading services.
Our trading plans
are unemotional
and are always
invested with the
trend, which ever
way it is headed.
Fibtimer's
timing strategies MAKE
MONEY in
BOTH advancing & declining
markets. No more
sleepless nights.
No more upset
stomachs.
We profit year after year after year. In fact, we have been timing the markets
successfully for over 25 years.
Join us and start
winning!
We
are currently offering HALF
PRICE to
new subscribers.
---
Available ONLY This
Weekend - only
$12.25 monthly
Special
HALF PRICE Offer - CLICK
HERE NOW
|
|
Considering the losses this week it
is surprising that VIX is holding at
21.63.
VIX is calling for continued volatility.
The uptrend has broken down.
Market Internals
The number of stocks trading above
their 200-day average closed at a new
low this week.
77% of stocks in the NYSE are trading "below" their
200-day average lines
Only 22.97% of stocks
in the NYSE are above their 200-day
average lines as of the close Friday.
Sentiment Indicator
This is a contrarian
indicator. Typically, when advisors
are mostly bullish, the markets are
often near a top.
Note that these numbers
are from a week ago. They reflect
the preceding week's sentiment.
The
number of bulls remains high. Remember
that those who are neither bullish
nor bearish have bullish positions
and really should be considered bullish.
Add bulls and those not specifically
bearish and you get 79.6%
with at least some bullish market positions.
Fibonacci Support
/ Resistance Levels
We are now looking at "support
levels" from the correction lows.
Fib support levels on the weekly chart
are as follows; the 38.2% retracement
support at 2508, the 50% retracement
support at 2375 and the critical 61.8%
retracement support at 2242.
Market Moving
Economic Reports Released this Week:
Job openings totaled 7.079 million
in November, up 1.7 percent vs 6.96
million in October and just shy of
August's record of 7.293 million. The
current number of openings is more
than 1 million above the number of
unemployed who have been actively looking
for work, at 6.075 million in a direct
comparison with October that since
fell to 5.975 million in last week's
employment report for November. The
number of job openings first broke
above the number of unemployed back
in April this year and have been inversion
ever since.
Optimism among small business owners
ebbed to the lowest level in 7 months,
according to the Small Business Optimism
Index, which fell 2.6 points in November
to 104.8, below the Econoday consensus
as well as the range of analysts' expectations.
More than half of the decline stemmed
from an 11-point drop to a net 22 percent
in expectations that the economy will
improve, and a drop in expected real
sales, which fell 4 points to a net
26 percent.
A jump in wholesale food prices and
traction in service prices offset an
expected drop in energy prices making
for a 0.1 percent increase in headline
producer prices for November which
is 1 tenth higher than Econoday's consensus
for no change. Ex-energy readings are
the key to today's report and show
steady and moderate pressure, at a
0.3 percent rise when excluding food
and energy and a 0.3 percent rise when
excluding food, energy and trade services.
|
Fibtimer HALF
PRICE Offer!
Get
Our Full Reports
Every Weekend
plus Updates
Every Trading
Day
These
FREE reports are NOT enough
Receive our reports in Real-Time!
only
$12.25 monthly
Available
this Weekend
Bull & Bear
Timer
10 Year Results
Fibtimer Timing + 284.2 % |
3
Year Results
Fibtimer Timing + 65.8 %
|
Sleepless
nights as your
investments are
consumed by a volatile
Wall Street?
Consider Fibtimer's
trend trading services.
Our trading plans
are unemotional
and are always
invested with the
trend, which ever
way it is headed.
Fibtimer's
timing strategies MAKE
MONEY in
BOTH advancing & declining
markets. No more
sleepless nights.
No more upset
stomachs.
We profit year after year after year. In fact, we have been timing
the markets successfully for over 25 years.
Join us and start winning!
We
are currently offering HALF
PRICE to
new subscribers.
---
Available ONLY This
Weekend - only
$12.25 monthly
Special
HALF PRICE Offer - CLICK
HERE NOW
|
|
Same store sales were up 6.6 percent
year-on-year in the December 8 week,
extending the previous week's deceleration
from the strongest growth pace in over
12 years by another 0.4 percentage
points. Month-to-date sales versus
the prior month were down 0.5 percent,
matching the weakest reading since
the week of June 23, while the full
month year-on-gain shrank by 0.2 percentage
points from the prior week to 6.6 percent.
A sharp decline in interest rates
gave a boost to mortgage activity in
the December 7 week, with purchase
applications for home mortgages rising
a seasonally adjusted 3 percent from
the prior week and their year-on-year
unadjusted gain increasing by 3.8 percentage
points to 4 percent.
A mixed-to-soft consumer price report
for November won't be adding much rate-hike
pressure at next week's FOMC meeting.
The CPI came in as expected at no change
with the ex-food ex-energy core rate
also at expectations, up 0.2 percent.
Energy fell 2.2 percent in the month
with gasoline down 4.2 percent reflecting
the month's $20 drop in oil. Sharp
declines were also posted for apparel
at minus 0.9 percent, transportation
down 0.8 percent, and education/communications
down 0.5 percent. Housing, which is
the main component in the CPI, held
at trend with a moderate 0.3 percent
rise with medical care, another large
component, picking back up with a 0.4
percent increase.
Through October and November initial
jobless claims had been pivoting higher
off historic lows but that's old news.
In data for the December 8 week, claims
fell a very sharp 27,000 to a much
lower-than-expected 206,000 for the
best showing since the historic lows
of mid-September. For the first time
in five weeks the 4-week average is
down, 3,750 lower at 224,750 which
is still, however, over 10,000 higher
than early November.
A steep 12.1 percent drop in prices
of petroleum imports pulled total import
prices down a sharper-than-expected
1.6 percent in November. Yet there's
wider price weakness in the data. When
excluding petroleum, import prices
are still in the negative column, at
minus 0.3 percent in the month. Import
prices of finished goods, whether capital
goods, consumer goods, or autos, were
dead flat in the month with industrial
supplies, which often have petroleum
components, falling sharply.
Export prices likewise show weakness,
falling an unexpected 0.9 percent in
November despite a welcome 1.8 percent
price bounce for agricultural exports.
Export prices for industrial supplies
fell 3.0 percent in the month with
export prices for finished goods flat
to marginally negative in the month.
Sharp contraction in gasoline sales
held down November retail sales which
rose 0.2 overall and also 0.2 percent
when excluding autos. When excluding
autos and also gasoline, the strength
starts to show with a 0.5 percent gain
and when looking at the control group,
which excludes gasoline and several
other components that slowed in November,
sales really jump, up 0.9 percent in
a reading that ultimately defines the
strength of the results.
Big jumps for utilities and mining
more than offset a flat performance
at manufacturers to make for a 0.6
percent jump in November industrial
production. Utility output surged 3.3
percent in November following two months
of soft results tied to hurricane disruptions
while mining output, which sank sharply
in October, rose 1.7 percent.
December's initial PMI samples report
noticeably slowing rates of growth,
at a 53.6 composite flash for a roughly
1 point decline in November and the
softest showing since May last year.
Services make up the bulk of the composite
and the index here likewise fell a
point to 53.4 to indicate the slowest
rate of growth in 11 months. Output
and orders both slowed for this sample.
Conclusion:
The SPX dclined to a new low this
week with most of the losses occurring
on Friday when the index lost -1.91%.
The weakness in the breadth charts
continues. Both the NYSE A-D line,
and NYSE stocks trading below their
200-day averages, made new lows this
week.
The potential that we have finished
a two-year bullish 5-wave Elliott Wave
pattern (weekly chart below). If this
is correct, the decline that follows
truly could be substantial. The Elliott
Wave pattern is on the weekly chart
below.
If we close below the closing lows
reached in March, that would confirm
that the Elliott Wave pattern has ended.
The SPX portion of this
strategy is BEARISH. Aggressive traders
should be in CASH (money market funds).
S&P 500 Index (SPX) Daily Chart
S&P 500 Index (SPX), Weekly Chart
Nasdaq 100 Index (NDX) Chart Analysis
Last week we wrote:
"The Nasdaq 100 Index
(NDX) has completed a "death-cross" pattern
in both its daily and weekly charts."
This week:
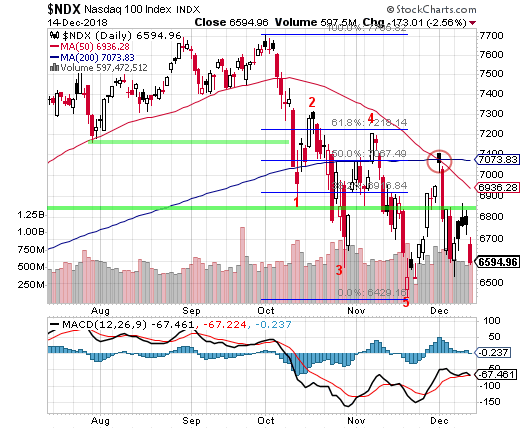
The Nasdaq 100 Index (NDX) lost -2.56% on Friday
alone erasing all weekly gains. As mentioned
last week the NDX has also suffered a bearish "death-cross" pattern.
MACD on the volatile daily chart is now in bearish
territory and this week had a bearish crossover.
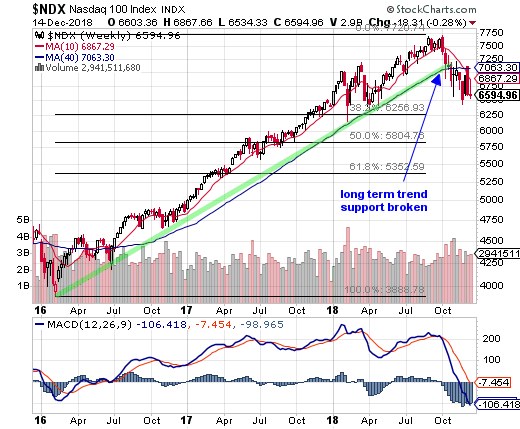
On the more stable weekly chart MACD has had
a steep bearish crossover and has closed in bearish
territory.
The NDX (chart) has held up better than the
SPX and considerably better than the small caps.
But still the tech index closed near its lows
and is now down -14.4% from its bull market highs
reached in September.
|
Fibtimer HALF
PRICE Offer!
Get
Our Full Reports
Every Weekend
plus Updates Every Trading Day
These FREE reports are
great, but getting our timing signals daily is
what you need to beat the market!
only
$12.25 monthly for
full year
Bull & Bear
Timer
10 Year Results
Fibtimer Timing + 284.2 % |
3
Year Results
Fibtimer Timing + 65.8 %
|
Sleepless
nights as your investments are consumed
by a volatile Wall Street?
Consider Fibtimer's
trend trading services. Our trading
plans are unemotional and are always
invested with the trend, which
ever way it is headed.
Fibtimer's
timing strategies MAKE
MONEY in BOTH advancing & declining
markets. No more sleepless nights.
No more upset stomachs.
We profit year after year after year. In fact, we have been timing
the markets successfully for over 25 years.
Join us and start winning!
We
are currently offering HALF
PRICE to new and returning
subscribers.
--- only
$12.25 monthly for full year
Special
HALF PRICE Offer - CLICK
HERE NOW
|
|
We have posted Fibonacci retracement "support" levels
for the advance from the February 2016 lows. Those
Fib support levels (weekly chart) are; 38.2% at
NDX 6256, 50% at NDX 5804 and 61.8% at NDX 5352.
Conclusion:
As we wrote in the SPX analysis above, Monday's
very poor breadth that occurred as the market reversed
and rallied, was a bearish indicator for the rest
of the week.
Though the NDX tacked on some 69 points for the
day, there were only 1258 advancing stocks vs.
1854 declining stocks.
The NDX remains below its 200-day average and
last week had a so-called "death-cross" where
the 50-day average crosses below the 200-day average.
The NDX portion of this strategy
is BEARISH. Aggressive traders should be in CASH
(money market funds).
Nasdaq 100 Index (NDX), Daily Chart
Nasdaq 100 Index (NDX), Weekly Chart
|