|
These free reports, twice a month, are
useful, but to successfully trade market
trends you need our daily reports. At
half price they are an affordable and
valuable tool for creating profits in
the stock market.
Special
HALF PRICE Offer ---> CLICK
HERE NOW
S&P
500 Index (SPX) Chart Analysis
Last week:
"The Thanksgiving
holiday week is historically a bullish
one. Not this time. After losses of
-1.7% and -1.8% on Monday and Tuesday,
the S&P 500 Index (SPX) took off
with a rally on Wednesday. At one point
nearing a 1.0% gain. But the selling
began midday and by the close, the SPX
was up only a fraction, and the Dow
actually closed with a loss after being
up as much as much +206 points."
This week:
It's hard to find something bearish about
a 2+% gain like we had on Wednesday. It
was not confirmed by a gain on Thursday
is one red flag, though we did get a rally
on Friday.
Wednesday's big rally was based on a
news event. You cannot know ahead of time
how a news event will affect the stock
market. If it was possible, the rally
would have occurred the day before.
News events do not usually change trends,
though if the event is big enough it could.
On Friday the SPX still did not close
above its 200-day average. Also, that
average is nearing a bearish crossover
by its 50-day average.
Yet the short-term trend is obviously
improving and our aggressive strategy
is moving back into bullish positions.
The question now becomes, is this the
type of market action that will take us
to new all-time highs and beyond: a so-called
Santa Claus rally?
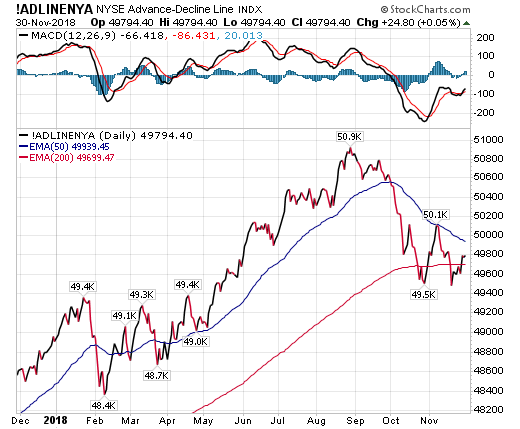
The Advance-Decline Line for the NYSE
Composite Index is not supporting the
current rally.
In fact it only just reached its 200-day
average line
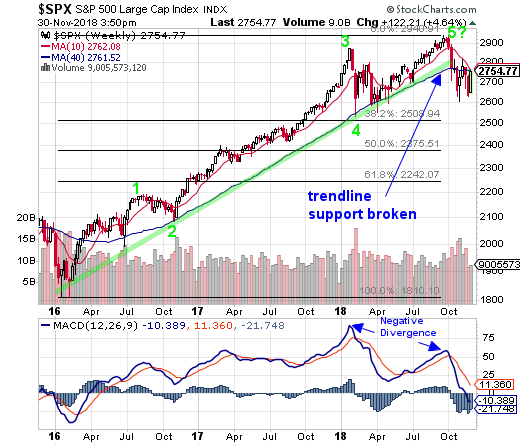
The weekly chart of the SPX has several
bearish patterns. We discussed them last
week and have them again here as they
are important.
|
Fibtimer HALF
PRICE Offer!
Get
Our Full Reports
Every Weekend
plus Updates Every Trading Day
These FREE reports
are great, but getting our timing signals daily is
what you need to beat the market!
only
$12.25 monthly for
full year
Bull & Bear
Timer
10 Year Results
Fibtimer Timing + 287.0 % |
3
Year Results
Fibtimer Timing + 67.2 %
|
Sleepless
nights as your investments are
consumed by a volatile Wall Street?
Consider Fibtimer's
trend trading services. Our trading
plans are unemotional and are always
invested with the trend,
which ever way it is headed.
Fibtimer's
timing strategies MAKE
MONEY in BOTH advancing & declining
markets. No more sleepless nights.
No more upset stomachs.
We profit year after year after year. In fact, we have been timing
the markets successfully for over 25 years.
Join us and start winning!
We
are currently offering HALF
PRICE to new and returning
subscribers.
--- only
$12.25 monthly for full year
Special
HALF PRICE Offer - CLICK
HERE NOW
|
|
1. There is a bearish divergence in
the latest two SPX highs and MACD which
did not make new highs. The weekly chart
shows the new high in the end of September
but a failure to make a new high in MACD.
2. There is also what looks to be a
bullish five wave pattern (Elliott Waves)
that ended in early October. If this
pattern has completed we are looking
at a decline, potentially, to SPX 2242.
Not instantly of course, but over coming
months.
3. The two-year long trend support line
has been broken.
Look at the increase in volume during
this decline and the lack of volume this
week on the upside. The SPX 2600 level
is where the February decline found support.
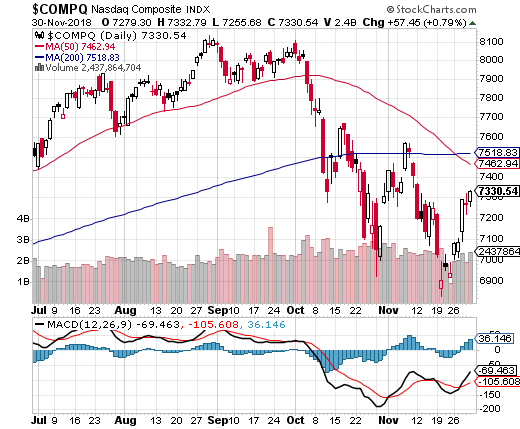
The Nasdaq Composite Index (COMPQ) had
a bearish so-called death cross when
the 50 day crossed below its 200 day
average.
This broader index now joins the Russell
2000 Small Cap (RUT) with a bearish death-cross
pattern.
According to data published Wednesday
by Goldman Sachs’ Portfolio Strategy
Research, the share of large-cap mutual
funds outperforming their benchmarks
fell from 63% in April to 33% through
the end of the third quarter
General Motors will lay off 14,700 factory
and white-collar workers in North America
and put five plants up for possible closure
as it restructures to cut costs and focus
more on autonomous and electric vehicles.
|
Fibtimer HALF
PRICE Offer!
Get
Our Full Reports
Every Weekend
plus Updates
Every Trading
Day
These
FREE reports are NOT enough
Receive our reports in Real-Time!
only
$12.25 monthly
Available
this Weekend
Bull & Bear
Timer
10 Year Results
Fibtimer Timing + 287.0 % |
3
Year Results
Fibtimer Timing + 67.2 %
|
Sleepless
nights as your
investments are
consumed by a volatile
Wall Street?
Consider Fibtimer's
trend trading services.
Our trading plans
are unemotional
and are always
invested with the
trend, which ever
way it is headed.
Fibtimer's
timing strategies MAKE
MONEY in
BOTH advancing & declining
markets. No more
sleepless nights.
No more upset
stomachs.
We profit year after year after year. In fact, we have been timing the markets
successfully for over 25 years.
Join us and start
winning!
We
are currently offering HALF
PRICE to
new subscribers.
---
Available ONLY This
Weekend - only
$12.25 monthly
Special
HALF PRICE Offer - CLICK
HERE NOW
|
|
Regularly
Followed Weekly Charts
NYSE Advance-Decline
Line
The NYSE A-D Line managed to close
above its 200-day line.
MACD has posted a bullish crossover
but remains in bearish territory for
the first time since March.
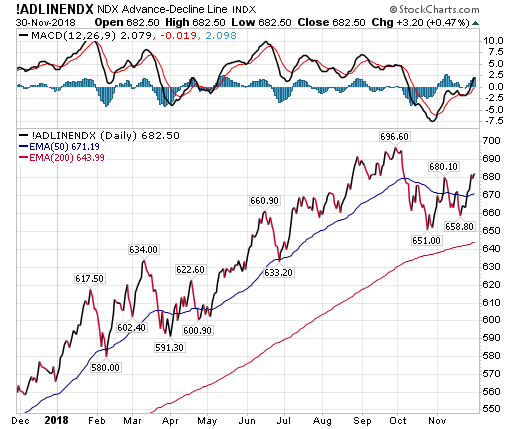
The Nasdaq 100 Index Advance-Decline Line continues to do much better than
the NYSE A-D Line, this week moving back above its 50-day moving average
line.
MACD is rising and has crossed into
bullish territory.
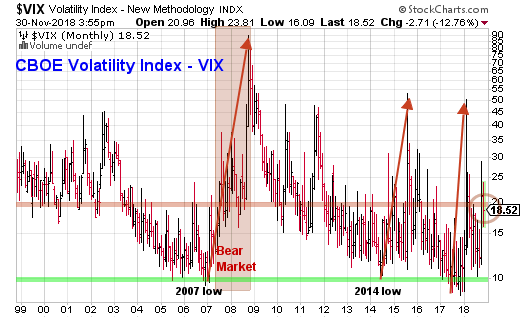
CBOE Volatility
Index (VIX)
The CBOE Volatility Index (VIX) is
back below the red line set at VIX
20.0. Not by much though, closing at
18.52.
VIX is calling for continued volatility
and appears to have not accepted this
week's rally as a new lasting trend.
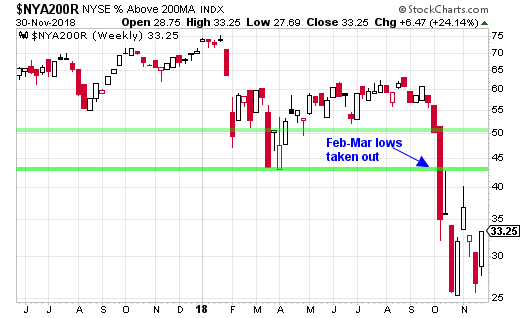
Market Internals
The number of stocks trading above
their 200-day average rose as expected
this week, but remains at very lows
levels.
The losses substantially exceed the
February-March selloff which is a worry.
Only 33.25% of stocks
in the NYSE above their 200-day average
lines is a disturbingly low number.
Consider that fully 66.75%
of the 1600 stocks on the NYSE are
now "below" their 200-day
line.
Sentiment Indicator
This is a contrarian
indicator. Typically, when advisors
are mostly bullish, the markets are
often near a top.
Note that these numbers
are from a week ago. They reflect
the preceding week's sentiment.
The
number of bulls remains high. Remember
that those who are neither bullish
nor bearish have bullish positions
and really should be considered bullish.
Add bulls and those not specifically
bearish and you get 79.4%
with at least some bullish market positions.
|
Fibtimer HALF
PRICE Offer!
Get
Our Full Reports
Every Weekend
plus Updates
Every Trading
Day
These
FREE reports are NOT enough
Receive our reports in Real-Time!
only
$12.25 monthly
Available
this Weekend
Bull & Bear
Timer
10 Year Results
Fibtimer Timing + 287.0 % |
3
Year Results
Fibtimer Timing + 67.2 %
|
Sleepless
nights as your
investments are
consumed by a volatile
Wall Street?
Consider Fibtimer's
trend trading services.
Our trading plans
are unemotional
and are always
invested with the
trend, which ever
way it is headed.
Fibtimer's
timing strategies MAKE
MONEY in
BOTH advancing & declining
markets. No more
sleepless nights.
No more upset
stomachs.
We profit year after year after year. In fact, we have been timing
the markets successfully for over 25 years.
Join us and start winning!
We
are currently offering HALF
PRICE to
new subscribers.
---
Available ONLY This
Weekend - only
$12.25 monthly
Special
HALF PRICE Offer - CLICK
HERE NOW
|
|
Fibonacci Support
/ Resistance Levels
We are now looking at "support
levels" from the correction lows.
Fib support levels on the weekly chart
are as follows; the 38.2% retracement
support at 2508, the 50% retracement
support at 2375 and the critical 61.8%
retracement support at 2242.
Market Moving
Economic Reports Released this Week:
Employment gave a sizable boost to
the national activity index in October
which rose to a higher-than-expected
0.24 vs Econoday's consensus for 0.20
and against a revised 0.14 in September.
Employment-related indicators contributed
0.19 to October's index vs only 0.05
in September as payroll growth more
than doubled to 250,000.
Same store sales were up 7.9 percent
year-on-year in the November 24 week,
sharply accelerating by 1.7 percentage
points to the strongest annual growth
pace in at least 12 years. Month to
date sales versus the prior month were
up 0.8 percent, while the full month
year-on-year gain rose to 6.7 percent,.
Case-Shiller's 20-city index posted
a moderate and expected 0.3 percent
monthly rise in September though the
unadjusted year-on-year missed Econoday's
consensus, moderating by 4 tenths to
5.1 percent vs expectations for 5.3
percent. The year-on-year rate, along
with FHFA's 6.0 percent rate also posted
this morning, are at roughly 2-year
lows.
The FHFA house price index edged only
0.2 percent higher in September for
the weakest showing since March this
year and missing Econoday's consensus
by 1 tenth. The year-on-year rate,
at 6.0, slipped 3 tenths from August
for the softest showing since January
last year.
The consumer confidence index, at
135.7 in November, continues to hold
in the mid-130s area and not far from
the all-time high of 144.7 reached
in 2000. November's strength is in
the present situation which is a favorable
indication for holiday spending, at
172.7 for an 8 tenths gain from October.
Expectations, however, eased by 4.1
points to 111.0 as optimism over future
job and income prospects is easing
slightly.
New-home sales ran at a seasonally
adjusted annual 544,000 rate in October,
the Commerce Department said Wednesday.
October’s selling pace for new
single-family homes was 8.9% lower
than September’s, although that
report was revised upward.
A downtick in mortgage rates spurred
homebuyers in the November 23 week,
with purchase applications rising a
seasonally adjusted 9 percent from
the prior week to lift their unadjusted
level back into positive year-on-year
territory, 2 percent higher than in
the same week last year.
Two wildcard components are slightly
more exaggerated in the third quarter's
revised GDP data while readings on
the consumer and housing are mixed.
At the headline level, the second revision
to third-quarter GDP is unrevised at
a very strong 3.5 percent annualized
growth rate but inventories, contributing
2.27 percentage points to the total,
added a little more than the first
revision while net exports, subtracting
1.91 points, pulled down GDP by a little
more.
After-tax corporate profits rose a
year-on-year 5.9 percent in the third-quarter
to $1.976 trillion without inventory
valuation and capital consumption adjustments.
When including inventory valuation
and capital consumption adjustments,
pre-tax corporate profits rose a year-on-year
10.3 percent to $2.318 trillion with
after-tax profits at $2.074 trillion
for a 19.4 percent gain.
U.S. pending home sales slid 2.6%
to a reading of 102.1 in October from
104.8 in September, the National Association
of Realtors said Thursday. That was
the lowest since June 2014. NAR’s
index, which tracks real estate contract
signings, was down 6.7% compared to
a year ago.
Initial claims are up for a third
straight week, 10,000 higher in the
November 24 week to a 234,000 level
that is outside high estimates for
228,000. The 4-week average is up a
sizable 4,750 to 223,250 which is suddenly
the highest reading since July. There
are no special factors distorting today's
report.
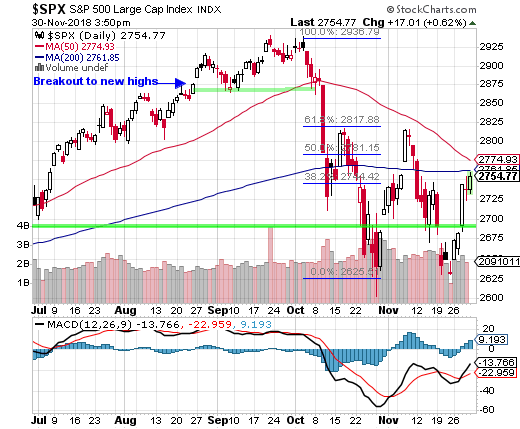
Conclusion:
The SPX posted a solid rally this
week completely erasing the prior week's
losses.
Yet the SPX was not able to close
above its 200-day moving average line.
The weakness in the breadth charts
continues. Both the NYSE A-D line and
the NYSE Stocks trading above their
200-day averages are near their lows.
The potential that we have finished
a two-year bullish 5-wave Elliott Wave
pattern (weekly chart below). If this
is correct, the decline that follows
truly could be substantial.
Last week we wrote: "Could
we see a rally? Certainly. An oversold
stock market can rally at any time.
But the bearish indicators are such
that any rally will likely reverse."
This week we had that rally and this
aggressive strategy will enter a bullish
position on Monday. When the traded
index reaches breakout level we will
trade it.
The SPX portion of this
strategy is BULLISH. Aggressive traders
should be in the Rydex Nova S&P
500 Fund - RYNVX (or other bullish
S&P 500 index fund or ETF such
as SPY or RSP
S&P 500 Index (SPX) Daily Chart
S&P 500 Index (SPX), Weekly Chart
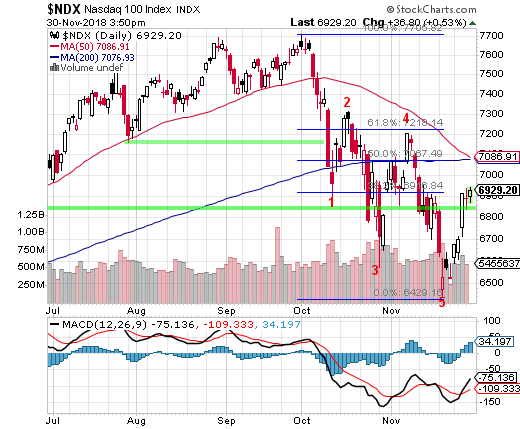
Nasdaq 100 Index (NDX) Chart Analysis
Last week we wrote:
"The Nasdaq 100 Index
(NDX) has closed at a new low since the selling
began back in early October. The NDX is down
over 1170 points and 15.2% since early October.
The index was down -4.95% this week alone and
-7.4% in the last two weeks."
This week:
The Nasdaq 100 Index (NDX) rallied this week
completely erasing the prior week's losses.
Interestinly, the weekly chart of the NDX posted
a death-cross pattern when the 50-day average
has closed below the 200-day average.
Yet the daily chart, while close, did not have
the pattern. Next week will likely resolve this.
MACD on the volatile daily chart is now deep
in bearish territory but had a bullish crossover
this week.
|
Fibtimer HALF
PRICE Offer!
Get
Our Full Reports
Every Weekend
plus Updates Every Trading Day
These FREE reports are
great, but getting our timing signals daily is
what you need to beat the market!
only
$12.25 monthly for
full year
Bull & Bear
Timer
10 Year Results
Fibtimer Timing + 287.0 % |
3
Year Results
Fibtimer Timing + 67.2 %
|
Sleepless
nights as your investments are consumed
by a volatile Wall Street?
Consider Fibtimer's
trend trading services. Our trading
plans are unemotional and are always
invested with the trend, which
ever way it is headed.
Fibtimer's
timing strategies MAKE
MONEY in BOTH advancing & declining
markets. No more sleepless nights.
No more upset stomachs.
We profit year after year after year. In fact, we have been timing
the markets successfully for over 25 years.
Join us and start winning!
We
are currently offering HALF
PRICE to new and returning
subscribers.
--- only
$12.25 monthly for full year
Special
HALF PRICE Offer - CLICK
HERE NOW
|
|
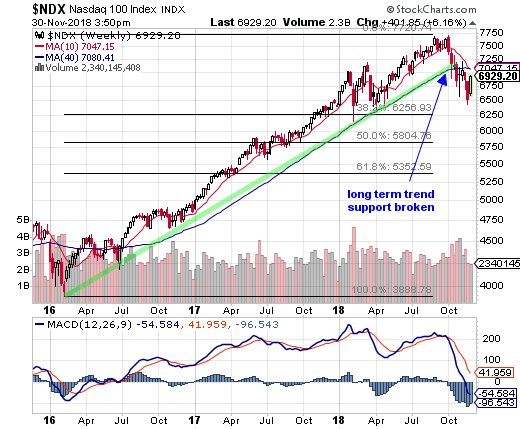
On the weekly chart MACD has had a steep bearish
crossover and has closed in bearish territory.
We have posted Fibonacci retracement "support" levels
for the advance from the February 2016 lows. Those
Fib support levels (weekly chart) are; 38.2% at
NDX 6256, 50% at NDX 5804 and 61.8% at NDX 5352.
Conclusion:
We have what looks like a bearish double-top in
the NDX on the daily chart. The index closed at
a new correction low last week but reversed and
erased all that week's losses.
A strong rally by any measure.
Yet the NDX remains below its 200-day average
and as we wrote above, is threatening a death-cross
pattern.
The gain this week has triggered buy signal for
this aggressive strategy.
The NDX portion of this strategy
is BULLISH. Aggressive traders should be in the
Rydex NDX 100 Fund - RYOCX (or other bullish NDX
100 index fund or ETF such as QQQ).
Nasdaq 100 Index (NDX), Daily Chart
Nasdaq 100 Index (NDX), Weekly Chart
|