|
S&P
500 Index (SPX) Chart Analysis
Last week:
"Currently, 70.34%
of S&P 500 components are above
their 50-day moving averages. Last week,
this ratio hit 75%, which represented
the highest such reading since late
January, when major indexes last hit
records."
This week:
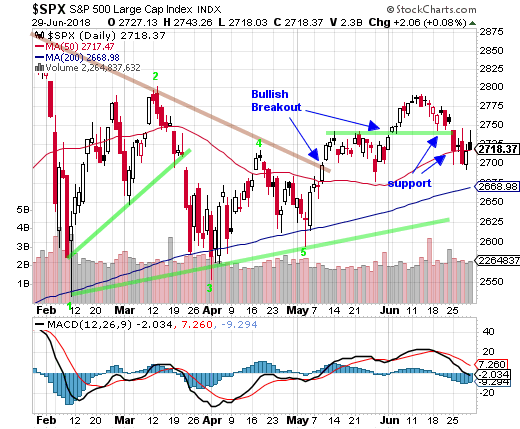
The 50-day moving average appears to
be key for this pullback. The S&P
500 Index traded below initial support
(horizontal green line) and then reached
its 50-day average line and closed the
week right at that line.
On Wednesday the SPX and most of the
major indexes rallied back up to that
initial support line but then collapsed
and closed below the 50-day line. Wednesday
was a bearish outside reversal day.
These occur when the market trades higher
than the previous day's highs and then
closes lower than the previous day's lows.
Very bullish intra-day sentiment is suddenly
reversed and all the gains are erased.
Though that reversal day was followed
by gains on Thursday, Another rally on
Friday also collapsed and most of the
early gains were erased. On Friday the
SPX closed lower than it opened.
Last week we wrote: "This does
not mean we are at a top as records
are broken all the time, but it does
mean we need to follow all sell signals
immediately. One of them could be the
one that is the start of a bear market."
The end-of-day selling on Friday was
a bit ominous. This comes after the bearish
outside reversal day on Wednesday and
investors have the entire weekend to think
about it.
That said, the July 4th week is usually
a bullish one. Obviously if a typically
bullish holiday week does not end with
gains, that would likely point to lower
lows ahead.
Another bearish indicator and possibly
the most important is the NYSE Advance-Decline
Line. Last week we wrote that the line
had turned lower but a single bad week,
while a concern, did not point to lower
lows.
|
Fibtimer HALF
PRICE Offer!
Get
Our Full Reports
Every Weekend
plus Updates Every Trading Day
These FREE reports
are great, but getting our timing signals daily is
what you need to beat the market!
only
$12.25 monthly for
full year
Bull & Bear
Timer
10 Year Results
Fibtimer Timing + 291.4 % |
3
Year Results
Fibtimer Timing + 67.8 %
|
1
Year Results
Fibtimer Timing + 29.1.%
|
Sleepless
nights as your investments are
consumed by a volatile Wall Street?
Consider Fibtimer's
trend trading services. Our trading
plans are unemotional and are always
invested with the trend,
which ever way it is headed.
Fibtimer's
timing strategies MAKE
MONEY in BOTH advancing & declining
markets. No more sleepless nights.
No more upset stomachs.
We profit year after year after year. In fact, we have been timing
the markets successfully for over 25 years.
Join us and start winning!
We
are currently offering HALF
PRICE to new and returning
subscribers.
--- only
$12.25 monthly for full year
Special
HALF PRICE Offer - CLICK
HERE NOW
|
|
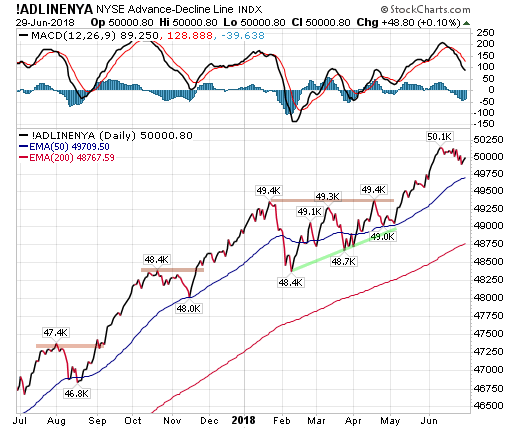
This week the A-D line closed lower
again. Support is at the 50-day average
for this indicator.
MACD is headed lower having made a bearish
crossover three weeks ago.
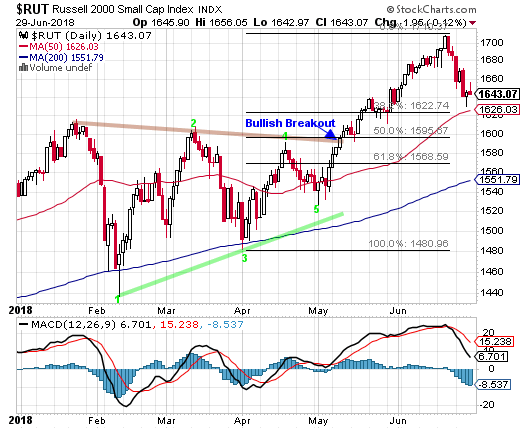
A big concern is small caps which have
been leading the stock market advance
since early May.
Small caps hit new bull market highs
two weeks ago but the sector sold off
during the last seven trading sessions.
Small caps did bounce off their 50-day
average line which is good, but they
also suffered that rally reversal on
Friday that took a gain and turned it
into a loss to end this week.
Small caps lost a whopping -2.52% for
the full week, though our small cap strategy
posted a nice +9.2% sell signal gain
for the preceding advance.
Well respected market technician Ralph
Acampora stated he is very concerned
about recent stock market actions.
He says that the bullish dynamic in
equities may be unraveling. That is particularly
the case after the Dow DJIA, -1.26% for
the week closed below its 200-day moving
average for the first time since June
2016, and as key components of the blue-chip
benchmark spiraled lower.
There are many big-players who will
see this break of the 200-day line as
a sell signal and who will be watching
Monday's trading closely.
|
Fibtimer HALF
PRICE Offer!
Get
Our Full Reports
Every Weekend
plus Updates
Every Trading
Day
These
FREE reports are NOT enough
Receive our reports in Real-Time!
only
$12.25 monthly
Available
this Weekend
Bull & Bear
Timer
10 Year Results
Fibtimer Timing + 291.4 % |
3
Year Results
Fibtimer Timing + 67.8 %
|
1
Year Results
Fibtimer Timing + 29.1.%
|
Sleepless
nights as your
investments are
consumed by a volatile
Wall Street?
Consider Fibtimer's
trend trading services.
Our trading plans
are unemotional
and are always
invested with the
trend, which ever
way it is headed.
Fibtimer's
timing strategies MAKE
MONEY in
BOTH advancing & declining
markets. No more
sleepless nights.
No more upset
stomachs.
We profit year after year after year. In fact, we have been timing the markets
successfully for over 25 years.
Join us and start
winning!
We
are currently offering HALF
PRICE to
new subscribers.
---
Available ONLY This
Weekend - only
$12.25 monthly
Special
HALF PRICE Offer - CLICK
HERE NOW
|
|
Regularly
Followed Weekly Charts
NYSE Advance-Decline
Line
Market breadth closed lower still
this week after losing ground in the
previous week. This after new highs
and a rally lasting five weeks.
Good breadth is the number one indicator
of a healthy stock market.
MACD has turned lower and had a bearish
crossover in mid-June.
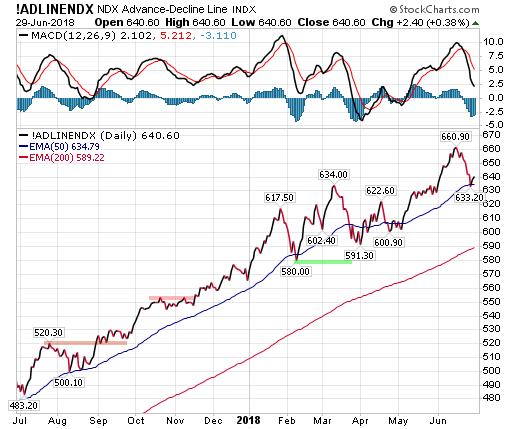
The Nasdaq 100 Index Advance-Decline Line continued the previous week's decline
and only stopped moving lower during Thursday's advance.
On Thursday the NDX A-D line reversed
off its 50-day moving average line
which is a positive.
But as we wrote last week, one week
of declines is not a concern but this
is now the second week of losses.
The 50-day needs to hold. If not we
have substantially lower lows ahead.
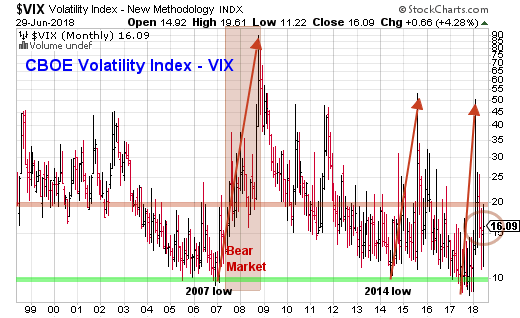
CBOE Volatility
Index (VIX).
The CBOE Volatility Index (VIX) reached
19.61 during the week. It closed at
16.09 but VIX was down at 11.22 during
this month.
Extreme bullishness is contrarian
bearish (eventually).
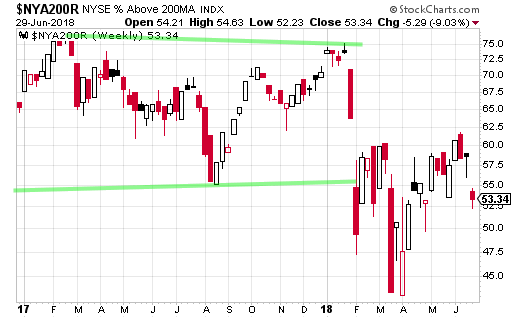
Market Internals
The number of stocks
trading above their 200-day average
declined -9.0% this week.
By the close on Friday
53.34% of stocks were trading above
their 200-day average line.
This was down from 58.64%
the previous week.
Sentiment Indicators
These are contrarian
indicators. Typically, when advisors
are mostly bullish, the markets are
near a top.
Note that these numbers
are from a week ago. They reflect
the preceding week's sentiment.
The
number of bulls remains high. Remember
that those who are neither bullish
nor bearish have bullish positions
and really should be considered bullish.
Add bulls and those not specifically
bearish and you get 81.6%
with at least some bullish market positions.
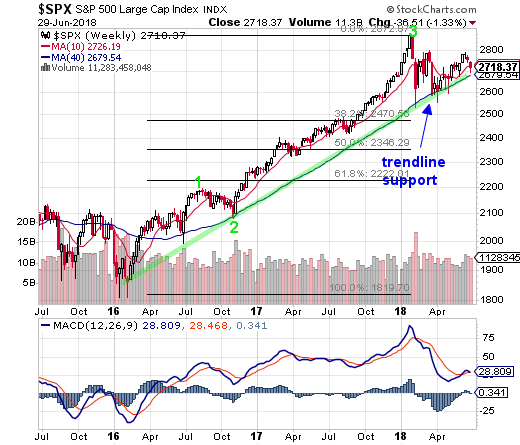
Fibonacci Support
/ Resistance Levels
We are now looking at "support
levels" from the correction lows.
Fib support levels on the weekly chart
are as follows; the 38.2% retracement
support at 2470, the 50% retracement
support at 2346 and the critical 61.8%
retracement support at 2222.
Market Moving
Economic Reports Released this Week:
Sales of newly-constructed homes were
6.7% higher than a downwardly-revised
April pace, and 14.1% higher than a
year ago, the Commerce Department said
Monday. New-home sales ran at a seasonally
adjusted annual 689,000 rate in May.
Americans are still very optimistic
about the U.S. economy, but a little
less so than they were a month ago.
The consumer confidence index slid
to 126.4 this month from a revised
128.8 in May, according to the nonprofit
Conference Board that publishes the
report. Economists surveyed by MarketWatch
had forecast a 128.0 reading
|
Fibtimer HALF
PRICE Offer!
Get
Our Full Reports
Every Weekend
plus Updates
Every Trading
Day
These
FREE reports are NOT enough
Receive our reports in Real-Time!
only
$12.25 monthly
Available
this Weekend
Bull & Bear
Timer
10 Year Results
Fibtimer Timing + 291.4 % |
3
Year Results
Fibtimer Timing + 67.8 %
|
1
Year Results
Fibtimer Timing + 29.1.%
|
Sleepless
nights as your
investments are
consumed by a volatile
Wall Street?
Consider Fibtimer's
trend trading services.
Our trading plans
are unemotional
and are always
invested with the
trend, which ever
way it is headed.
Fibtimer's
timing strategies MAKE
MONEY in
BOTH advancing & declining
markets. No more
sleepless nights.
No more upset
stomachs.
We profit year after year after year. In fact, we have been timing
the markets successfully for over 25 years.
Join us and start winning!
We
are currently offering HALF
PRICE to
new subscribers.
---
Available ONLY This
Weekend - only
$12.25 monthly
Special
HALF PRICE Offer - CLICK
HERE NOW
|
|
Home prices slowed going into and
during the early part of the Spring
selling season with Case-Shiller the
latest to confirm the softening. Case-Shiller's
20-city adjusted index managed only
a 0.2 percent gain in April to come
up short of Econoday's low estimate.
The year-on-year rate, at 6.6 percent,
is no better than the low estimate.
Disruption tied to a fire at an auto
supplier not only pulled down the previously
released manufacturing component of
the industrial production report but
it also helped pull down durable goods
orders in May which fell an as-expected
0.6 percent. Vehicle orders fell 4.2
percent in the month with vehicle shipments
down 4.4 percent
Retail inventories, trying to keep
pace with rising strength in retail
sales, rose 0.4 percent in May following
a 0.5 percent build in April, both
of which are positives for second-quarter
GDP.
U.S. pending home sales declined 0.5%
to a reading of 105.9 in May, the National
Association of Realtors said Wednesday.
NAR’s index, which tracks real-estate
transactions in which a contract has
been signed but the transaction hasn’t
yet closed, hit a four-month low in
May.
Inflation was a little bit warmer
than thought in the first quarter,
a factor that deflates the third estimate
of first-quarter GDP more than expected
which came in at a 2.0 percent annualized
rate to just make the low end of Econoday's
consensus range. The GDP price index
came in at 2.2 percent.
Initial jobless claims rose more than
expected in the June 23 week but remain
very low, at 227,000 which lifts the
4-week average only marginally to 222,000.
This average is roughly in line with
readings in May which points convincingly
at another strong employment report
for the month of June. Continuing claims,
where data lag by a week, fell 21,000
to 1.705 million with this 4-week average
down 3,000 to 1.720 million.
Consumers were upbeat about June but
turned less optimistic on the outlook.
These were the results of Tuesday's
report on consumer confidence and today's
consumer sentiment report. June's current
conditions component rose a sharp 5.7
points to 116.5 which hints at bounce-back
strength for the month's consumer spending,
but the expectations component, subdued
by tariff concern, fell 2.8 points
to 86.3 which is lowest reading since
mid-January.
Conclusion:
There was continued downside this
week but of more concern were the two
bearish reversal days. The first on
Wednesday was a bearish outside reversal
day and then on Friday a rally almost
completely disappeared by the close.
Breadth declined for the second week
in a row. The July 4th week is typically
a bullish one. Maybe we will see gains.
If not though we could be in for a
rough July.
The SPX portion of this
strategy is BEARISH. Aggressive traders
should be in CASH (money market funds).
S&P 500 Index (SPX) Daily Chart
S&P 500 Index (SPX), Weekly Chart
Nasdaq 100 Index (NDX) Chart Analysis
Last week we wrote:
"Technology stocks finally
pulled back this week after almost continuous
gains for the sector since early May. For the
full week the Nasdaq 100 Index (NDX) dropped
-0.80%."
This week:
Tech stocks took a big tumble on Monday of this
week and it did not get any better during the
rest of the week. For the full week the Nasdaq
100 Index (NDX) dropped -2.18%.
On Wednesday the NDX suffered a bearish outside
reversal day. Typically there will be lower lows
after such a reversal day.
|
Fibtimer HALF
PRICE Offer!
Get
Our Full Reports
Every Weekend
plus Updates Every Trading Day
These FREE reports are
great, but getting our timing signals daily is
what you need to beat the market!
only
$12.25 monthly for
full year
Bull & Bear
Timer
10 Year Results
Fibtimer Timing + 291.4 % |
3
Year Results
Fibtimer Timing + 67.8 %
|
1
Year Results
Fibtimer Timing + 29.1.%
|
Sleepless
nights as your investments are consumed
by a volatile Wall Street?
Consider Fibtimer's
trend trading services. Our trading
plans are unemotional and are always
invested with the trend, which
ever way it is headed.
Fibtimer's
timing strategies MAKE
MONEY in BOTH advancing & declining
markets. No more sleepless nights.
No more upset stomachs.
We profit year after year after year. In fact, we have been timing
the markets successfully for over 25 years.
Join us and start winning!
We
are currently offering HALF
PRICE to new and returning
subscribers.
--- only
$12.25 monthly for full year
Special
HALF PRICE Offer - CLICK
HERE NOW
|
|
The lows on Wednesday broke below the initial
support level at NDX 7000. The NDX dropped to its
rising 50-day average early on Thursday before
closing with a gain.
But similar to the SPX, a rally on Friday was
mostly erased by the close to end the week lower.
MACD on the daily chart has made a bearish crossover.
On the weekly chart MACD remains in bullish territory
and has posted a bullish crossover.
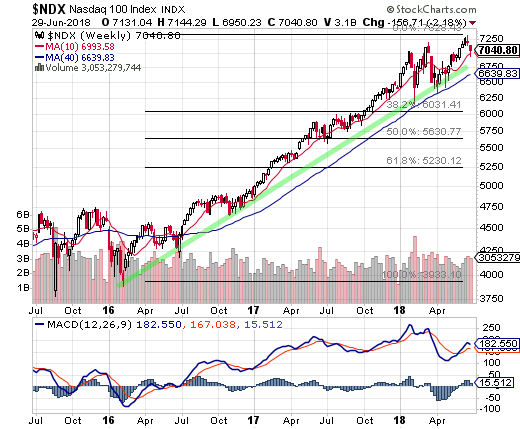
We have posted Fibonacci retracement "support" levels
for the advance from the February 2016 lows. Those
Fib support levels (weekly chart) are; 38.2% at
NDX 6031, 50% at NDX 5630 and 61.8% at NDX 5230.
Conclusion:
A second week of declines and those declines have
escalated.
A big concern is the NDX Advance-Decline line
which dropped for a second week.
The NDX portion of this strategy
is BEARISH. Aggressive traders should be in CASH
(money market funds).
Nasdaq 100 Index (NDX), Daily Chart
Nasdaq 100 Index (NDX), Weekly Chart
|