|
S&P
500 Index (SPX) Chart Analysis
Last week:
"After successfully
testing its 200-day moving average line
on Thursday, the S&P 500 Index (SPX)
opened at that line on Friday and then
posted a reversal rally that will likely
trigger a buy signal in coming days.
The reversal did trigger a buy in the
Nasdaq 100 Index (NDX) portion of this
strategy which will result in a 50%
invested position for the strategy at
the close on Monday."
This week:
Last week we had a breakout for the Nasdaq
100 Index (NDX). This week the S&P
500 Index (SPX) also broke out as well
as most of the major indexes.
There are several very bullish indicators
pointing to this rally being the one that
finally puts the correction to rest.
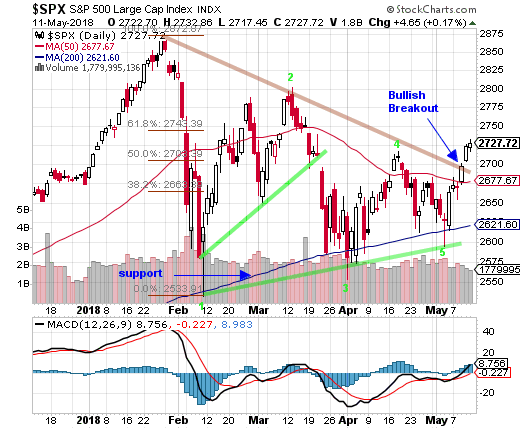
First, the below chart shows a pennant
pattern. Breakouts or breakdowns from
pennant patterns typically point to the
direction the stock market will now take.
On Wednesday the SPX closed above its
long-term declining trend resistance line
(top line of the pennant.) This was followed
by an upside gap opening the following
day.
Second, pennant patterns tend to have
a five wave pattern. Last week's lows
were the wave five of a clearly marked
Elliott Wave pattern. Wave five was followed
by the breakout.
Third, this was the third test of the
200-day moving average line as well as
the rising trend support line (lower line
of the pennant.) This correction has lasted
much longer than typical. The market was
due a reversal and rally that potentially
will again reach the prior highs.
The third test of major support, if successful,
tends to be the final one.
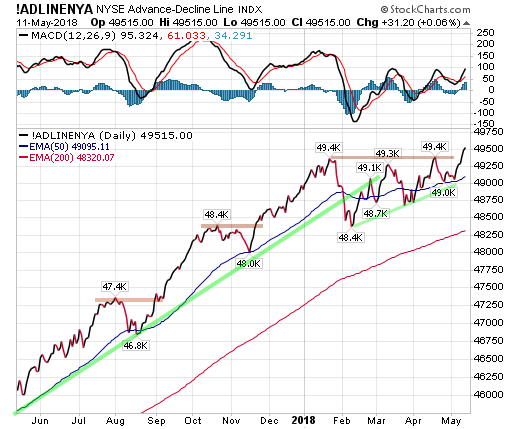
Another huge positive is the NYSE Advance-Decline
Line which broke out to a new bull market
high.
This means it was not just a few powerful
companies pulling the market up, but most
of the companies in the NYSE which has
1600 stocks.
Lastly small caps almost closed at a
new bull market high. Small caps have
been strong for weeks now and this week
they tested their 50-day line which held.
Not the 200-day line like the other indexes,
but the 50-day. The test of the 50-day
also completed a five-wave pattern.
|
Fibtimer HALF
PRICE Offer!
Get
Our Full Reports
Every Weekend
plus Updates Every Trading Day
These FREE reports
are great, but getting our timing signals daily is
what you need to beat the market!
only
$12.25 monthly for
full year
Bull & Bear
Timer
10 Year Results
Fibtimer Timing + 288.9 % |
3
Year Results
Fibtimer Timing + 59.2 %
|
1
Year Results
Fibtimer Timing + 35.5.%
|
Sleepless
nights as your investments are
consumed by a volatile Wall Street?
Consider Fibtimer's
trend trading services. Our trading
plans are unemotional and are always
invested with the trend,
which ever way it is headed.
Fibtimer's
timing strategies MAKE
MONEY in BOTH advancing & declining
markets. No more sleepless nights.
No more upset stomachs.
We profit year after year after year. In fact, we have been timing
the markets successfully for over 25 years.
Join us and start winning!
We
are currently offering HALF
PRICE to new and returning
subscribers.
--- only
$12.25 monthly for full year
Special
HALF PRICE Offer - CLICK
HERE NOW
|
|
Small caps broke above their declining
trend resistance line and closed just
a fraction from new highs.
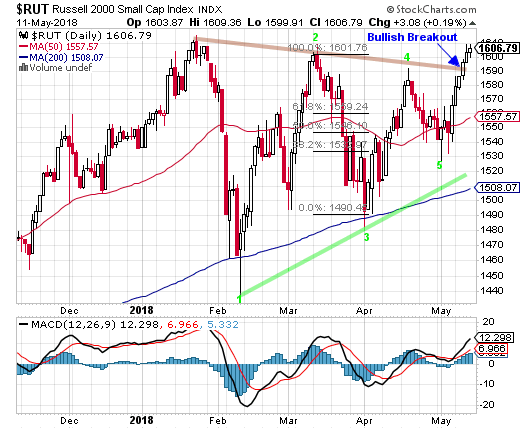
One last item. MACD managed to close
in bullish territory.
Regularly
Followed Weekly Charts
NYSE Advance-Decline
Line
Market breadth has broken out to a new
high. Not just a fractional new high
but a solid breakout.
Interestingly the A-D line also formed
a five-wave pattern and each down wave
ended with a higher low. Each up wave
has had a higher high.
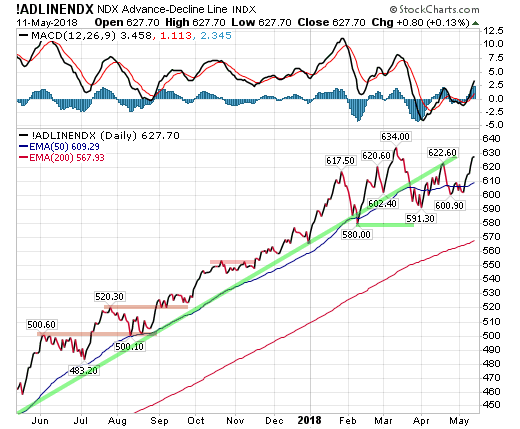
The Nasdaq 100 Index Advance-Decline
Line closed this week well above its
50-day average.
The NDX A-D line appears to be following
its 50-day average with weekly closes
both above and below it.
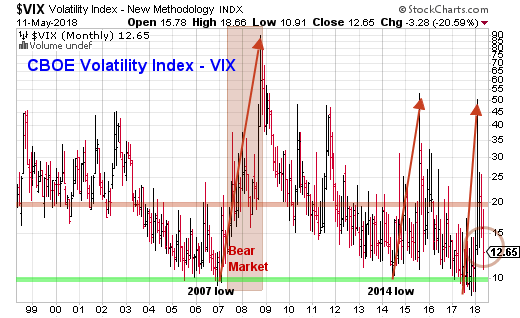
CBOE Volatility
Index (VIX).
The CBOE Volatility Index (VIX) had
a substantial decline this week, closing
at 12.65.
This tells us that investors are turning
bullish. They do not feel the need to
cover their positions with insurance
in the form of options.
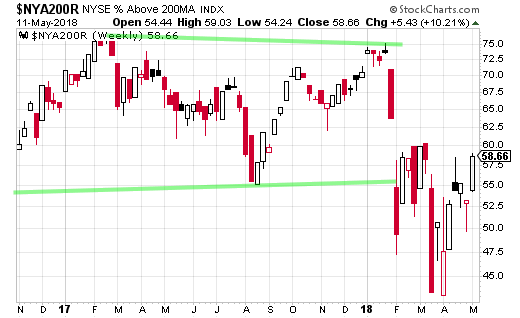
Market Internals
The NYSE percent of stocks
that are trading above their 200-day
averages jumped this week and has now
erased half of its correction losses.
|
Fibtimer HALF
PRICE Offer!
Get
Our Full Reports
Every Weekend
plus Updates
Every Trading
Day
These
FREE reports are NOT enough
Receive our reports in Real-Time!
only
$12.25 monthly
Available
this Weekend
Bull & Bear
Timer
10 Year Results
Fibtimer Timing + 288.9 % |
3
Year Results
Fibtimer Timing + 59.2 %
|
1
Year Results
Fibtimer Timing + 35.5.%
|
Sleepless
nights as your
investments are
consumed by a volatile
Wall Street?
Consider Fibtimer's
trend trading services.
Our trading plans
are unemotional
and are always
invested with the
trend, which ever
way it is headed.
Fibtimer's
timing strategies MAKE
MONEY in
BOTH advancing & declining
markets. No more
sleepless nights.
No more upset
stomachs.
We profit year after year after year. In fact, we have been timing the markets
successfully for over 25 years.
Join us and start
winning!
We
are currently offering HALF
PRICE to
new subscribers.
---
Available ONLY This
Weekend - only
$12.25 monthly
Special
HALF PRICE Offer - CLICK
HERE NOW
|
|
By the close on Friday
58.66% of stocks were trading above
that line as compared to 53.22% the
prior week.
Sentiment Indicators
These are contrarian
indicators. Typically, when advisors
are mostly bullish, the markets are
near a top.
Note that these numbers
are from a week ago. They reflect
the preceding week's sentiment.
The
number of bulls remains high. Remember
that those who are neither bullish
nor bearish have bullish positions
and really should be considered bullish.
Add bulls and those not specifically
bearish and you get 79.4%
with at least some bullish market positions.
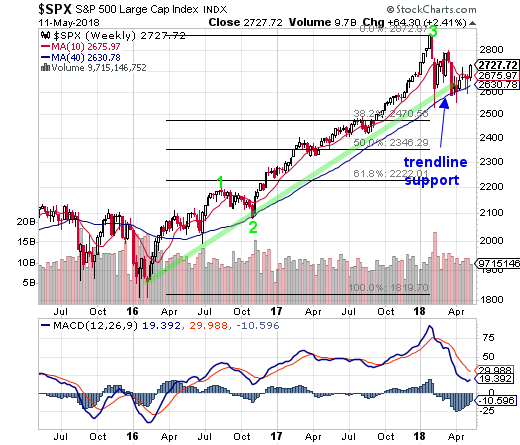
Fibonacci Support
/ Resistance Levels
We are now looking at "support
levels" from the correction lows.
Fib support levels on the weekly chart
are as follows; the 38.2% retracement
support at 2470, the 50% retracement
support at 2346 and the critical 61.8%
retracement support at 2222.
Market Moving
Economic Reports Released this Week:
A stronger increase in consumer credit
is the call for March, at a consensus
$15.6 billion vs $10.6 billion in February.
Growth in revolving credit has slowed
sharply this year and is one of the
factors that has held down consumer
spending.
The highest earnings improvement levels
in 45 years helped support small business
optimism in April after a sharp decline
in the previous month, according to
the National Federation of Independent
Business (NFIB), whose monthly Small
Business Optimism Index ticked up by
0.1 point in April to 104.8, roughly
in line with the consensus forecast.
The number of job openings in the
U.S. surged in March to a record 6.55
million from 6.1 million, showing companies
are still eager to add workers with
the economy growing soundly almost
nine years after the last recession.
There are more than enough job openings,
at 6.550 million in March, to give
everyone who's looking for a job, at
6.346 million in April's employment
report, a job. And though 5.425 million
were hired in March, the gap between
openings and hires in today's JOLTS
report, at 1.125 million, is the largest
on record which suggests that employers
are having a hard time finding people
with the right skills.
|
Fibtimer HALF
PRICE Offer!
Get
Our Full Reports
Every Weekend
plus Updates
Every Trading
Day
These
FREE reports are NOT enough
Receive our reports in Real-Time!
only
$12.25 monthly
Available
this Weekend
Bull & Bear
Timer
10 Year Results
Fibtimer Timing + 288.9 % |
3
Year Results
Fibtimer Timing + 59.2 %
|
1
Year Results
Fibtimer Timing + 35.5.%
|
Sleepless
nights as your
investments are
consumed by a volatile
Wall Street?
Consider Fibtimer's
trend trading services.
Our trading plans
are unemotional
and are always
invested with the
trend, which ever
way it is headed.
Fibtimer's
timing strategies MAKE
MONEY in
BOTH advancing & declining
markets. No more
sleepless nights.
No more upset
stomachs.
We profit year after year after year. In fact, we have been timing
the markets successfully for over 25 years.
Join us and start winning!
We
are currently offering HALF
PRICE to
new subscribers.
---
Available ONLY This
Weekend - only
$12.25 monthly
Special
HALF PRICE Offer - CLICK
HERE NOW
|
|
Purchase applications for home mortgages
fell a seasonally adjusted 0.2 percent
in the May 4 week, shrinking the unadjusted
year-on-year gain to 3 percent. Applications
for refinancing fell 1 percent from
the previous week to their lowest level
since October 2008, with the refinance
share of mortgage activity decreasing
by 0.2 percentage points to 36.3 percent,
the smallest share since September
2008.
Usually there's not much difference
between the advance inventory estimate
and the month's final, but there is
in March. Wholesale inventories rose
only 0.3 percent vs the advance gain
of 0.5 percent. The build however is
in line with sales which also rose
0.3 percent in the month to keep the
stock-to-sales ratio unchanged at 1.26.
Prices are up for steel and aluminum
but overall wholesale prices proved
subdued in April. The headline increase
of only 0.1 percent is 2 tenths below
Econoday's consensus and 1 tenth below
the low estimate. When excluding food,
where prices fell 1.1 percent, and
also energy, which inched only 0.1
percent higher, producer prices did
manage an as-expected 0.2 percent increase.
When excluding food and energy and
also a 0.2 percent gain for trade services,
the result is only plus 0.1 percent
which, like the headline, is below
the low estimate.
The number of people who applied for
U.S. unemployment benefits in early
May stood at 211,000 for the second
straight week, keeping initial jobless
claims near a 49-year low. New claims
were flat at 211,000 in the seven days
ended May 5, the government said Thursday.
The consumer price index rose 0.2%
in April, the government said Thursday.
A more closely followed measure that
strips out food and energy, known as
the core CPI, rose a smaller 0.1% last
month.
The consumer sentiment index held
steady at a solid 98.8 for preliminary
May led by a modest gain in the expectations
component, now at 89.5, which offset
a slight dip in the assessment of current
conditions, at 113.3. Year-ahead inflation
expectations edged 1 tenth higher to
2.8 percent, a level last matched back
in March this year but not surpassed
since March 2015.
Conclusion:
On Friday of last week the stock market
reversed higher from its 200-day moving
average line and this week that reversal
was confirmed with a strong rally that
broke through several important resistance
levels.
Last week's reversal also confirmed
this to be a five-wave decline which
is what was expected in a pennant pattern.
The SPX portion of this
strategy is BULLISH. Aggressive traders
should be in the Rydex Nova S&P
500 Fund - RYNVX (or other bullish
S&P 500 index fund or ETF such
as SPY or RSP).
S&P 500 Index (SPX) Daily Chart
S&P 500 Index (SPX), Weekly Chart
Nasdaq 100 Index (NDX) Chart Analysis
Last week we wrote:
"The Nasdaq 100 Index
(NDX) rallied on Friday and the advance pushed
this tech dominated index to its highest close
in three weeks. That close was also above its
50-day moving average line though it was not
above the highest April close reached mid-month."
This week:
Last week's Friday breakout
for the Nasdaq 100 Index (NDX) pushed the index
above its declining trend resistance line as
well as its 50-day moving average line.
The decline last week ended
just a fraction above the rising trend support
line and made this a five-wave corrective pattern
which is what we should see in a pennant pattern.
Most investors are shell-shocked from the volatility
and unexpected reversals and declines in this
correction. While nothing can be guaranteed,
this advance has the technical underpinnings
of a rally that will test and hopefully surpass
the prior highs.
The big news is the close above the declining
trend resistance line which had remained unbroken
since mid-march.
|
Fibtimer HALF
PRICE Offer!
Get
Our Full Reports
Every Weekend
plus Updates Every Trading Day
These FREE reports are
great, but getting our timing signals daily is
what you need to beat the market!
only
$12.25 monthly for
full year
Bull & Bear
Timer
10 Year Results
Fibtimer Timing + 288.9 % |
3
Year Results
Fibtimer Timing + 59.2 %
|
1
Year Results
Fibtimer Timing + 35.5.%
|
Sleepless
nights as your investments are consumed
by a volatile Wall Street?
Consider Fibtimer's
trend trading services. Our trading
plans are unemotional and are always
invested with the trend, which
ever way it is headed.
Fibtimer's
timing strategies MAKE
MONEY in BOTH advancing & declining
markets. No more sleepless nights.
No more upset stomachs.
We profit year after year after year. In fact, we have been timing
the markets successfully for over 25 years.
Join us and start winning!
We
are currently offering HALF
PRICE to new and returning
subscribers.
--- only
$12.25 monthly for full year
Special
HALF PRICE Offer - CLICK
HERE NOW
|
|
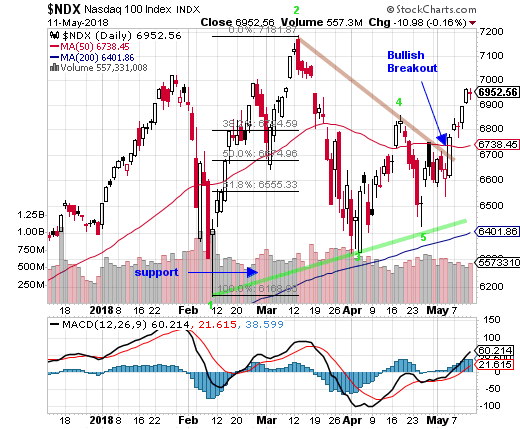
MACD on the daily chart remained bullish during
the week and closed at 60.21.
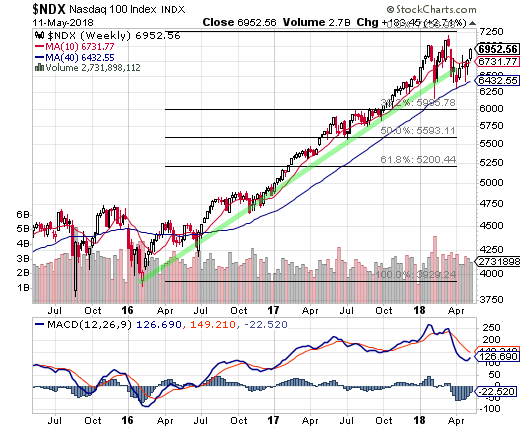
On the weekly chart MACD remains
in bullish territory and though it is still in
a bearish crossover, weekly MACD has reversed higher..
We have posted Fibonacci retracement "support" levels
for the advance from the February 2016 lows. Those
Fib support levels (weekly chart)
are; 38.2% at NDX 5995, 50% at NDX 5593 and 61.8%
at NDX 5200.
Conclusion:
Last week's Friday rally triggered a buy signal
for the NDX and the tech index posted a solid +2.71%
gain this week.
The NDX portion of this strategy
is BULLISH. Aggressive traders should be in the
Rydex NDX 100 Fund - RYOCX (or other bullish NDX
100 index fund or ETF such as QQQ).
Nasdaq 100 Index (NDX), Daily Chart
Nasdaq 100 Index (NDX), Weekly Chart
|