|
These free reports, twice a month, are
useful, but to successfully trade market
trends you need our daily reports. At
half price they are an affordable and
valuable tool for creating profits in
the stock market.
Special
HALF PRICE Offer ---> CLICK
HERE NOW
S&P
500 Index (SPX) Chart Analysis
Last week:
"Technically speaking,
the major indexes have staged an impressive
rally from the correction lows, with
single-day rallies exceeding 2%. The
S&P 500 has pushed above its 200-day
moving average, testing that average
on Friday and continuing to hold above
it."
This week:
On the weekly chart of the S&P 500
Index (SPX) there is a bearish divergence
in the latest SPX highs and MACD which
did not make new highs.
The below weekly chart shows the new
high in the end of September but a failure
to make a new high in MACD.
This was a warning of weakness to come.
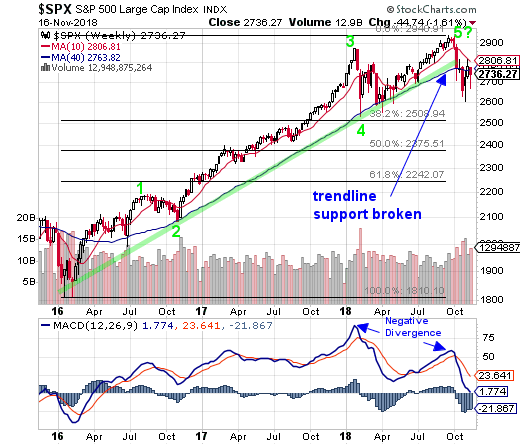
Add this bearish divergence to the previously
discussed potential of an Elliott Wave
top.
The above weekly chart of the SPX has
been labelled with this wave series for
months.
Basically we could be starting a correction
that would be expected after a five wave
Elliott Wave pattern is completed.
This has been a two year pattern and
it certainly looks like wave 5 may well
have been completed. A decline after such
a five wave pattern could be expected
to erase up to 61.8% of the gains.
That is a worst case scenario and it
might not even happen. But the potential
for substantial declines is something
to be watching for.
|
Fibtimer HALF
PRICE Offer!
Get
Our Full Reports
Every Weekend
plus Updates Every Trading Day
These FREE reports
are great, but getting our timing signals daily is
what you need to beat the market!
only
$12.25 monthly for
full year
Bull & Bear
Timer
10 Year Results
Fibtimer Timing + 287.0 % |
3
Year Results
Fibtimer Timing + 67.2 %
|
Sleepless
nights as your investments are
consumed by a volatile Wall Street?
Consider Fibtimer's
trend trading services. Our trading
plans are unemotional and are always
invested with the trend,
which ever way it is headed.
Fibtimer's
timing strategies MAKE
MONEY in BOTH advancing & declining
markets. No more sleepless nights.
No more upset stomachs.
We profit year after year after year. In fact, we have been timing
the markets successfully for over 25 years.
Join us and start winning!
We
are currently offering HALF
PRICE to new and returning
subscribers.
--- only
$12.25 monthly for full year
Special
HALF PRICE Offer - CLICK
HERE NOW
|
|
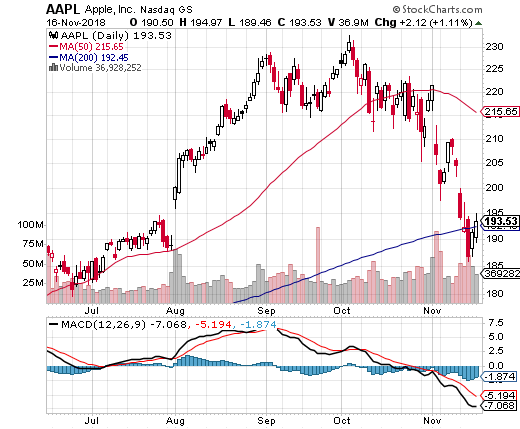
Although it rebounded from Wednesday's
low, the premier stock in the stock market
Apple, Inc. (AAPL) officially entered
a bear market that day on heavy volume.
That is bad news for the bull market
as a whole and by itself has caused selling
in technology stocks.
Apple lost -5.04% on Wednesday alone.
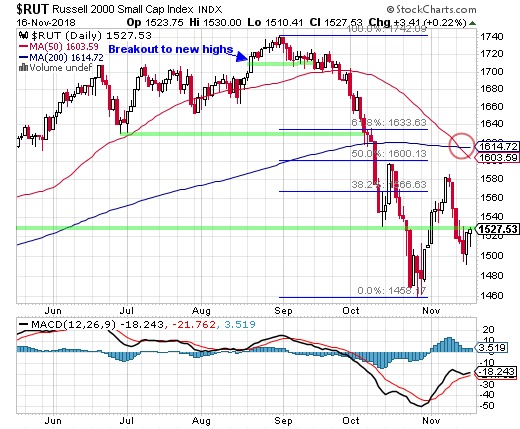
Some call it a "death cross" and
the name alone tells you how it is perceived
when the 50-day moving average line of
the small-cap Russell 2000 Index (RUT)
closed beneath its long-term 200-day
moving average.
Many chart watchers believe this is
the point that a short-term decline changes
into a longer-term downtrend.
This is the first time that the 50-day
crossed below its 200-day since May,
2016.
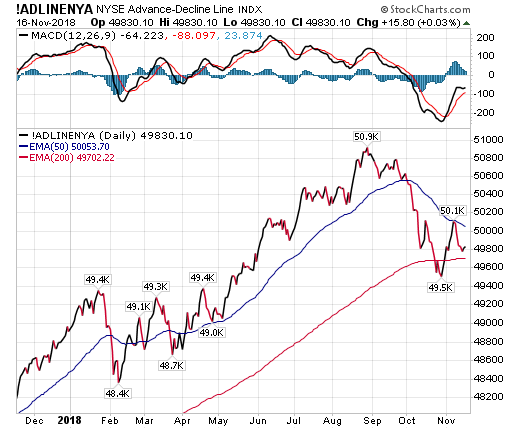
Lastly we look at the breadth charts
which are disturbing.
After a brief rally to the 50-day average,
the NYSE Advance-Decline Line fell back
to its 200-day average and the last two
days of this week, when prices improved,
are hardly a blip to the upside.
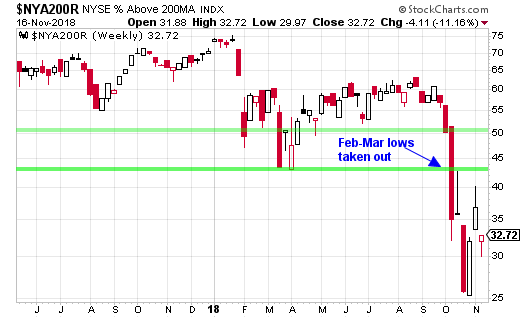
The number of stocks in the NYSE trading
above their 200-day line remains near
its lows.
Fully 67.3% of stocks in the NYSE Composite
Index of 1600 stocks remain below their
200-day averages.
|
Fibtimer HALF
PRICE Offer!
Get
Our Full Reports
Every Weekend
plus Updates
Every Trading
Day
These
FREE reports are NOT enough
Receive our reports in Real-Time!
only
$12.25 monthly
Available
this Weekend
Bull & Bear
Timer
10 Year Results
Fibtimer Timing + 287.0 % |
3
Year Results
Fibtimer Timing + 67.2 %
|
Sleepless
nights as your
investments are
consumed by a volatile
Wall Street?
Consider Fibtimer's
trend trading services.
Our trading plans
are unemotional
and are always
invested with the
trend, which ever
way it is headed.
Fibtimer's
timing strategies MAKE
MONEY in
BOTH advancing & declining
markets. No more
sleepless nights.
No more upset
stomachs.
We profit year after year after year. In fact, we have been timing the markets
successfully for over 25 years.
Join us and start
winning!
We
are currently offering HALF
PRICE to
new subscribers.
---
Available ONLY This
Weekend - only
$12.25 monthly
Special
HALF PRICE Offer - CLICK
HERE NOW
|
|
Regularly
Followed Weekly Charts
NYSE Advance-Decline
Line
The NYSE A-D Line moved up to its
50-day and then reversed lower.
MACD has posted a bullish crossover
but remains in bearish territory for
the first time since March.
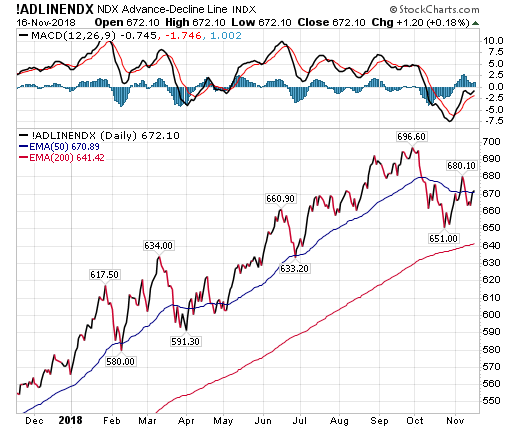
The Nasdaq 100 Index Advance-Decline Line never dropped to its 200-day average
and this week managed to regain its 50-day average and close fractionally
above.
The break above the 50-day line is
good, but the overall chart does not
look good.
MACD continues to rise and is nearing
bullish territory.
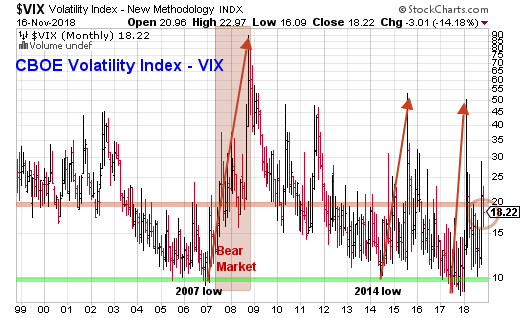
CBOE Volatility
Index (VIX)
The CBOE Volatility Index (VIX) closed
this week at 18.22.
This level does not give us any hint
at where stocks will go next week.
Market Internals
The number of stocks trading above
their 200-day average continues to
be a concern. Though you can see two
weeks of strong gains, still the number
of stocks below their 200-day line
is very high.
The losses substantially exceed the
February-March selloff which is a worry.
32.72% above their 200-day
average lines is a very low number.
Consider that fully 67.3%
of the 1600 stocks on the NYSE remain "below" their
200-day line.
Sentiment Indicator
This is a contrarian
indicator. Typically, when advisors
are mostly bullish, the markets are
often near a top.
Note that these numbers
are from a week ago. They reflect
the preceding week's sentiment.
The
number of bulls remains high. Remember
that those who are neither bullish
nor bearish have bullish positions
and really should be considered bullish.
Add bulls and those not specifically
bearish and you get 81.0%
with at least some bullish market positions.
Fibonacci Support
/ Resistance Levels
We are now looking at "support
levels" from the correction lows.
Fib support levels on the weekly chart
are as follows; the 38.2% retracement
support at 2508, the 50% retracement
support at 2375 and the critical 61.8%
retracement support at 2242.
Market Moving
Economic Reports Released this Week:
The National Federation of Independent
Business small-business optimism index
declined 0.5 point to a seasonally
adjusted 107.4 in October, a four-month
low. The biggest declines of the 10
components that make up the index came
from questions on expansion and earnings
trends, while the only gain came from
plans to increase inventories.
Same store sales were up 6.1 percent
year-on-year in the November 10 week,
unchanged from the prior week and maintaining
the strongest annual growth pace since
the 6.5 percent decade highs seen at
the start of October. Month-to-date
sales versus the prior month were up
0.2 percent, an acceleration of 0.1
percentage points from the prior week,
while the full month year-on-year gain
rose to 6.1 percent, the fastest pace
in 9 weeks.
|
Fibtimer HALF
PRICE Offer!
Get
Our Full Reports
Every Weekend
plus Updates
Every Trading
Day
These
FREE reports are NOT enough
Receive our reports in Real-Time!
only
$12.25 monthly
Available
this Weekend
Bull & Bear
Timer
10 Year Results
Fibtimer Timing + 287.0 % |
3
Year Results
Fibtimer Timing + 67.2 %
|
Sleepless
nights as your
investments are
consumed by a volatile
Wall Street?
Consider Fibtimer's
trend trading services.
Our trading plans
are unemotional
and are always
invested with the
trend, which ever
way it is headed.
Fibtimer's
timing strategies MAKE
MONEY in
BOTH advancing & declining
markets. No more
sleepless nights.
No more upset
stomachs.
We profit year after year after year. In fact, we have been timing
the markets successfully for over 25 years.
Join us and start winning!
We
are currently offering HALF
PRICE to
new subscribers.
---
Available ONLY This
Weekend - only
$12.25 monthly
Special
HALF PRICE Offer - CLICK
HERE NOW
|
|
Rising interest rates continue to
dampen mortgage activity, with purchase
applications for home mortgages falling
a seasonally adjusted 2.3 percent in
the November 9 week to the lowest level
since February 2017 while refinancing
applications decreased by 4.3 percent
to the lowest level since December
2000.
Energy prices which are now sliding
lifted what is yet another subdued
consumer inflation report, this time
for October where the headline, at
a moderate and as-expected 0.3 percent
increase, overstates the pressure.
Energy jumped 2.4 percent in October
led by a 3.0 percent rise in gasoline
prices which appear certain to come
down in the November report given the
ongoing tumble in the price of oil.
The core rate, which excludes energy
and also food, came in as expected
at 0.2 percent.
Initial jobless claims are steady
at low and favorable levels, edging
only 2,000 higher in the November 10
week to 216,000 with the 4-week average
up only 1,500 to a 215,250 level that
is only slightly higher than mid-October.
The first hard indication on what
to expect for fourth-quarter consumer
spending is positive but not as enormously
positive as October's 0.8 percent headline
surge in retail sales would suggest.
Control group sales, which importantly
are inputs into personal consumption
expenditures and which exclude categories
that were especially strong in October,
rose a more moderate 0.3 percent with
September for this reading revised
2 tenths lower to also a 0.3 percent
gain.
Last week's producer price report
showed unexpected pressure in October
as does today's report on import prices
and export prices, up 0.5 percent and
0.4 percent respectively which both
top Econoday's high estimates.
Industrial production edged up 0.1%
in October, the Federal Reserve said
Friday, but there was a big upward
revision that moved third-quarter numbers
significantly higher. Capacity utilization
fell to 78.4% from 78.5% in September.
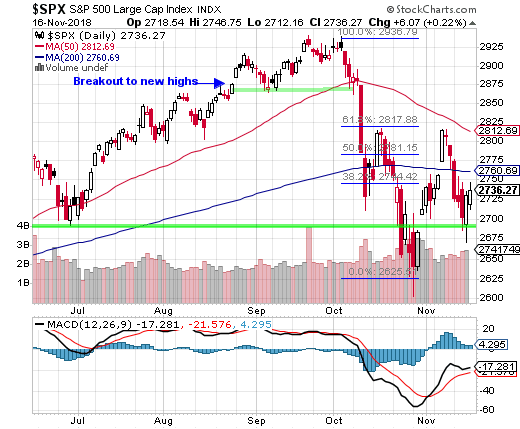
Conclusion:
The SPX is back in cash and has again
closed below its 200-day average line
at the close on Friday. For the full
week the SPX lost -1.61%.
The weakness in the breadth charts
is likely pointing to more selling
ahead, though there could be huge volatility
on a daily basis in both directions.
The potential that we have finished
a two-year bullish 5-wave Elliott Wave
pattern (weekly chart below). If this
is correct, the decline that follows
truly could be substantial.
The SPX portion of this
strategy is BEARISH. Aggressive traders
should be in CASH (money market funds).
S&P 500 Index (SPX) Daily Chart
S&P 500 Index (SPX), Weekly Chart
Nasdaq 100 Index (NDX) Chart Analysis
Last week we wrote:
"Although the Nasdaq 100
Index (NDX) managed to push above its 200-day
moving average this week, it did not hold.
By the close on Friday the NDX was off -1.67%
in one day closing at 7039.15."
This week:
The Nasdaq 100 Index (NDX) had only a single
day of gains this week and the tech index lost
a whopping -2.45% for the full week.
Again the NDX finds itself well below its 200-day
moving average line.
Breadth indicators improved last week for the
NDX with the A-D line trading above its 50-day
average for a short time, but this week the A-D
line closed decidedly lower and the rally on
Thursday resulted in only a small fractional
gain to the upside.
|
Fibtimer HALF
PRICE Offer!
Get
Our Full Reports
Every Weekend
plus Updates Every Trading Day
These FREE reports are
great, but getting our timing signals daily is
what you need to beat the market!
only
$12.25 monthly for
full year
Bull & Bear
Timer
10 Year Results
Fibtimer Timing + 287.0 % |
3
Year Results
Fibtimer Timing + 67.2 %
|
Sleepless
nights as your investments are consumed
by a volatile Wall Street?
Consider Fibtimer's
trend trading services. Our trading
plans are unemotional and are always
invested with the trend, which
ever way it is headed.
Fibtimer's
timing strategies MAKE
MONEY in BOTH advancing & declining
markets. No more sleepless nights.
No more upset stomachs.
We profit year after year after year. In fact, we have been timing
the markets successfully for over 25 years.
Join us and start winning!
We
are currently offering HALF
PRICE to new and returning
subscribers.
--- only
$12.25 monthly for full year
Special
HALF PRICE Offer - CLICK
HERE NOW
|
|
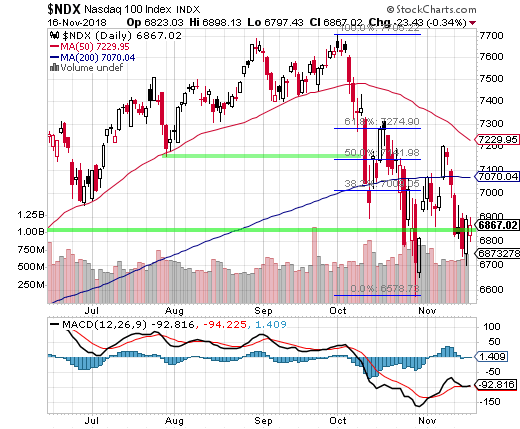
MACD on the volatile daily chart is now deep in
bearish territory and trading sideways.
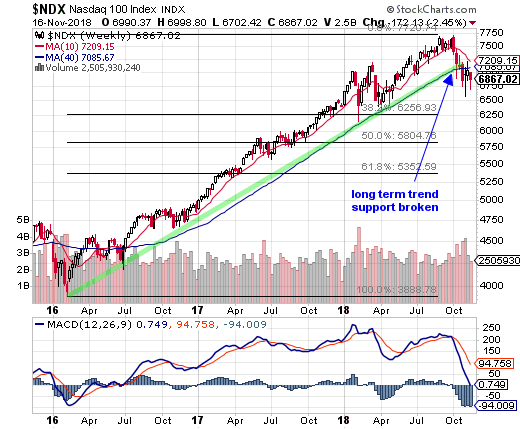
On the weekly chart MACD has had a steep bearish
crossover and is close to entering bearish territory.
We have posted Fibonacci retracement "support" levels
for the advance from the February 2016 lows. Those
Fib support levels (weekly chart) are; 38.2% at
NDX 6256, 50% at NDX 5804 and 61.8% at NDX 5352.
Conclusion:
We have what looks like a bearish double-top in
the NDX on the daily chart.
Last week the 200-day line was broken to the downside.
This week, with four down days, the NDX is again
far below this 200-day average line.
The NDX portion of this strategy is BEARISH. Aggressive
traders should be in CASH (money market funds).
Nasdaq 100 Index (NDX), Daily Chart
Nasdaq 100 Index (NDX), Weekly Chart
|