|
S&P
500 Index (SPX) Chart Analysis
Last week:
"Has everyone forgotten
last week? Selling that fast and steep
does not just end with a rally to new
highs. Try and remember the two days
that declined some 4% each. Those are
huge single day losses. They damage
the technical underpinnings of the stock
market."
This week:
Volatility still rules the
day. Big swings in price are the norm,
at least for now.
On Wednesday the Dow was up 303 points,
yet the big gain disappeared near the
end of the trading day, with the Dow losing
167 points at the close. That is a 470
point swing or about 1.9%.
It was also a bearish reversal
day in the S&P 500 Index (SPX). Bearish
reversal days occur when the index surges
to higher highs than the previous trading
day and then ends at lower lows than the
previous trading day.
They are bearish indicators
typically followed by several weeks of
lower lows. So far that has not been the
case.
On Friday the major indexes
rose in a broad advance. But while the
Nasdaq 100 Index (NDX) has broken above
resistance, the SPX and the Russell 2000
Small Cap Index (RUT) both remain just
below resistance.
That puts the NDX at a bullish
level and will force an entry (see below).
It also leaves the SPX and RUT still below
the resistance level. These levels are
capable of stopping an advance. So they
are important for any bullish entries.
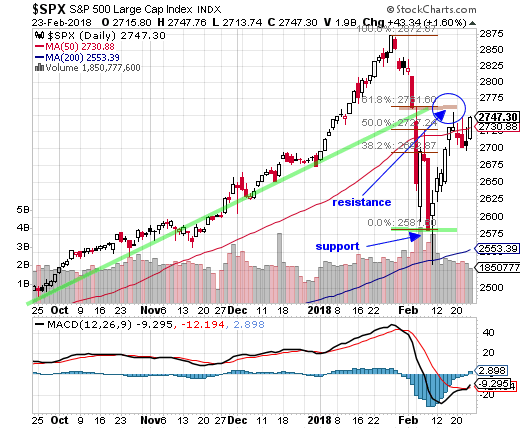
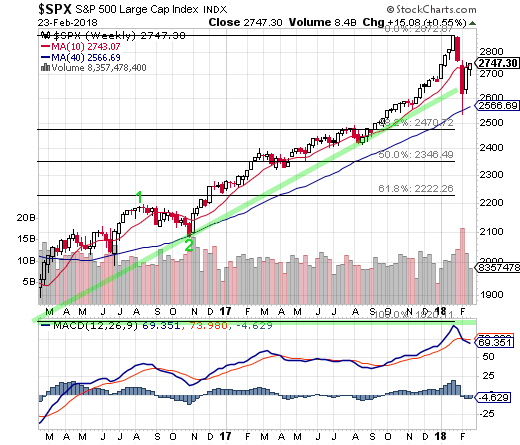
In the below chart of the
SPX you can see how the Fib 61.8% level
is acting as resistance. It was almost
reached last week and then the SPX sold
off all week with the exception of Friday.
Still, Friday's advance did not break
through the resistance level.
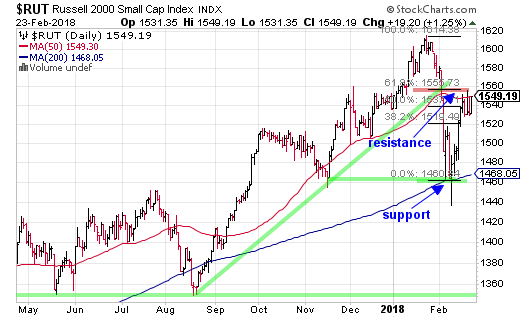
Below is the daily chart of the Russell
2000 Small Cap Index (RUT). We typically
look at this chart because it is moved
mostly by individual traders. The big
institutional traders use stocks in the
NYSE and SPX.
Support is at about the 200-day moving
average line. Resistance is at about RUT
1555 which is the Fib 61.8% resistance
level
|
Fibtimer HALF
PRICE Offer!
Get
Our Full Reports
Every Weekend
plus Updates Every Trading Day
These FREE reports
are great, but getting our timing signals daily is
what you need to beat the market!
only
$12.25 monthly for
full year
Bull & Bear
Timer
10 Year Results
Fibtimer Timing + 288.9 % |
3
Year Results
Fibtimer Timing + 59.2 %
|
1
Year Results
Fibtimer Timing + 35.5.%
|
Sleepless
nights as your investments are
consumed by a volatile Wall Street?
Consider Fibtimer's
trend trading services. Our trading
plans are unemotional and are always
invested with the trend,
which ever way it is headed.
Fibtimer's
timing strategies MAKE
MONEY in BOTH advancing & declining
markets. No more sleepless nights.
No more upset stomachs.
We profit year after year after year. In fact, we have been timing
the markets successfully for over 25 years.
Join us and start winning!
We
are currently offering HALF
PRICE to new and returning
subscribers.
--- only
$12.25 monthly for full year
Special
HALF PRICE Offer - CLICK
HERE NOW
|
|
Small caps also were unable to break
through the 61.8% resistance level. This
level is also right at the 50-day moving
average line. Strong resistance.
There are other major indexes
having the same problem. For example
overseas markets as represented by the
International markets iShares MSCI Index
Fund (EFA) are having difficulty pushing
through resistance at the Fib 61.8% level.
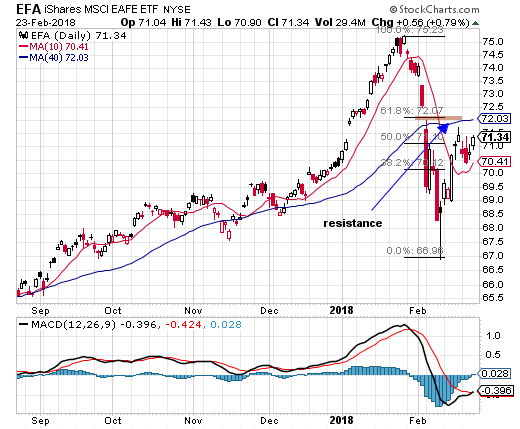
There are several major indexes unable, so far, to break through critical resistance.
Then there is the NDX which
pushed through with no difficulty. That
position (below) is being forced by our
strategy to enter a bullish position.
Interestingly, Federal Reserve policymakers
see an economy that may be past full
employment. That statement was a surprise.
Past full employment!
These conditions will continue to call
for more rate increases in 2018.
Fed watchers widely expect the FOMC
to approve a quarter-point rate hike
in March and likely two more through
the rest of 2018. Now there is talk of
a fourth hike.
Last week we wrote: "Of course
if it is (different this time) we will
have to adjust and start reentering.
But we are, at this point, looking
for a pull back and eventually a test
of the lows."
Apparently it is different for the NDX
and, so far, not for the other major
indexes.
|
Fibtimer HALF
PRICE Offer!
Get
Our Full Reports
Every Weekend
plus Updates
Every Trading
Day
These
FREE reports are NOT enough
Receive our reports in Real-Time!
only
$12.25 monthly
Available
this Weekend
Bull & Bear
Timer
10 Year Results
Fibtimer Timing + 288.9 % |
3
Year Results
Fibtimer Timing + 59.2 %
|
1
Year Results
Fibtimer Timing + 35.5.%
|
Sleepless
nights as your
investments are
consumed by a volatile
Wall Street?
Consider Fibtimer's
trend trading services.
Our trading plans
are unemotional
and are always
invested with the
trend, which ever
way it is headed.
Fibtimer's
timing strategies MAKE
MONEY in
BOTH advancing & declining
markets. No more
sleepless nights.
No more upset
stomachs.
We profit year after year after year. In fact, we have been timing the markets
successfully for over 25 years.
Join us and start
winning!
We
are currently offering HALF
PRICE to
new subscribers.
---
Available ONLY This
Weekend - only
$12.25 monthly
Special
HALF PRICE Offer - CLICK
HERE NOW
|
|
Regularly
Followed Weekly Charts
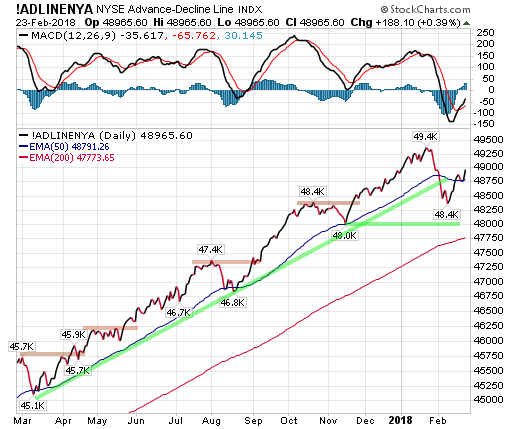
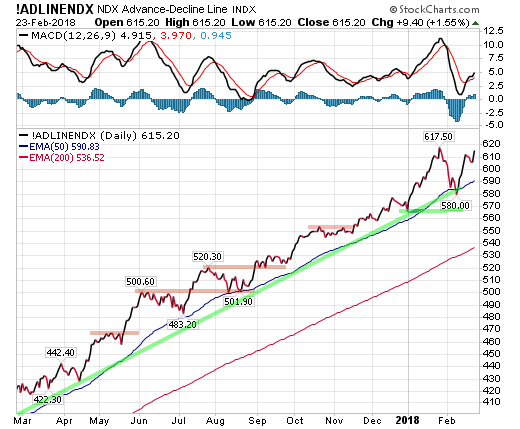
NYSE Advance-Decline
Line
The NYSE Advance-Decline line climbed
higher this week as Friday's advance
added to the gain. So far the A-D line
has made up about half of the losses.
We have support at about the 48000
level on the below chart.
Suprisinglyy, the A-D line is back
above its 50-day line.
The Nasdaq 100 Index Advance-Decline
Line decline hit its rising trend support
line last week. That line is also at
the same level as its 50-day moving
average.
Last week we wrote: "The
A-D line is at very strong support
levels. If they hold it would add
weight to a bottom occurring at this
point."
This is a perfect V bottom. But perfect
V bottoms are somewhat unusual.
Just as the NDX is outperforming other
indexes, so is the A-D line for the
NDX.
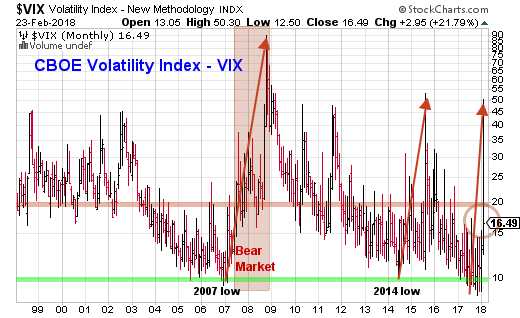
CBOE Volatility
Index (VIX).
The CBOE Volatility Index (VIX) closed
at 29.06% two weeks ago, improved to
19.46% last Friday and is now at 16.49%.
If you look at previous times that
VIX rose above 50.0 you will see that
during the weeks after there were many
VIX highs near 30-40. Only slowly did
VIX recover.
So far VIX has the one spike above
50.0 and since then it is mostly back
to normal.
It is either "different this
time" or we have not seen the
last of higher VIX readings ahead.
We extended this chart to a twenty
year time-frame to show what has occurred
every time VIX reached the 10.0 level.
A VIX 10.0 is considered by many to
be contrarian bearish, but VIX can
stay contrarian bearish for a while
once a strong rally is started.
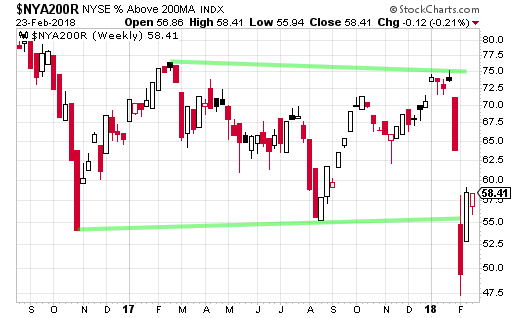
Market Internals
The number of NYSE stocks
trading back above their 200-day average
line stayed about the same, closing
Friday at 58.41%.
But this chart is still
down around its lower support level.
The coming weeks may see a great deal
of volatility in this chart.
Sentiment Indicators
These are contrarian
indicators. Typically, when advisors
are mostly bullish, the markets are
near a top.
Note that these numbers
are from a week ago. They reflect
the preceding week's sentiment.
The
number of bulls remains high. Remember
that those who are neither bullish
nor bearish have bullish positions
and really should be considered bullish.
Add bulls and those not specifically
bearish and you get 85.4%
with at least some bullish market positions.
Fibonacci Support
/ Resistance Levels
We are now looking at "support
levels" from the correction lows.
Fib support levels on the weekly chart
are as follows; the 38.2% retracement
support at 2470, the 50% retracement
support at 2346 and the critical 61.8%
retracement support at 2222.
Market Moving
Economic Reports Released this Week:
As interest rates continued to rise,
purchase applications for home mortgages
fell 6.0 percent on a seasonally adjusted
basis in the February 16 week, putting
the unadjusted year-on-year gain in
the Purchase Index at 3.0 percent,
down 1 percentage point from the prior
week. Applications for refinancing,
which are even more sensitive to mortgage
rates, fell 7.0 percent from the prior
week.
|
Fibtimer HALF
PRICE Offer!
Get
Our Full Reports
Every Weekend
plus Updates
Every Trading
Day
These
FREE reports are NOT enough
Receive our reports in Real-Time!
only
$12.25 monthly
Available
this Weekend
Bull & Bear
Timer
10 Year Results
Fibtimer Timing + 288.9 % |
3
Year Results
Fibtimer Timing + 59.2 %
|
1
Year Results
Fibtimer Timing + 35.5.%
|
Sleepless
nights as your
investments are
consumed by a volatile
Wall Street?
Consider Fibtimer's
trend trading services.
Our trading plans
are unemotional
and are always
invested with the
trend, which ever
way it is headed.
Fibtimer's
timing strategies MAKE
MONEY in
BOTH advancing & declining
markets. No more
sleepless nights.
No more upset
stomachs.
We profit year after year after year. In fact, we have been timing
the markets successfully for over 25 years.
Join us and start winning!
We
are currently offering HALF
PRICE to
new subscribers.
---
Available ONLY This
Weekend - only
$12.25 monthly
Special
HALF PRICE Offer - CLICK
HERE NOW
|
|
A surge in services and continued
strength in manufacturing pushed the
PMI composite to a 27-month high at
55.9 in the February flash, surprising
analysts and surpassing the Econoday
consensus range by a wide margin.
An uptick in supply and lower prices
failed to boost existing home sales
in January, which unexpectedly fell
3.2 percent versus the marginally downward
revised December to an annualized rate
of 5.380 million, well below the consensus
estimate of 5.650 million. Year-on-year,
home resales were down 4.8 percent.
Initial jobless claims continue to
post very favorable readings that remain
near historical lows, at 222,000 in
the February 17 week down 7,000 from
the previous week's downward revised
level, taking the 4-week average to
226,000, just shy of the 45-year low
seen two weeks ago.
The index of leading economic indicators
points to robust economic growth ahead,
accelerating in January to rise 1.0
percent following a 0.6 percent gain
in December. Contributing most to the
unexpectedly large gain in January
were building permits, stock prices
and once again ISM's new orders index,
where unusually strength has not yet
been translated to similar gains in
government data.
Manufacturing activity in the Kansas
City Fed's district posted very solid
growth in February, with the composite
score beating expectations by rising
1 point to 17. The production component
of the index rose 5 points to 21, as
factory activity increased particularly
for the production of metals, machinery,
and plastics.
Conclusion:
The SPX posted a substantial advance
on Friday, but for the full week had
only a + 0.55% gain.
There remains strong resistance at
about SPX 2760. This is the Fib 61.8%
retracement resistance level. A "decisive" close
above this level would likely end the
correction. But as long as this resistance
holds, we need to be careful of any
bullish entry.
We remain in cash.
The SPX portion of this
strategy is BEARISH. Aggressive traders
should be in CASH (money market funds).
S&P 500 Index (SPX) Daily Chart
S&P 500 Index (SPX), Weekly Chart
Nasdaq 100 Index (NDX) Chart Analysis
Last week we wrote:
"The Nasdaq 100 Index
(NDX) rallied this week as if a correction
had never happened in the prior weeks. The
NDX closed on Friday with a +5.58% gain. Though
the advance was powerful, we urge a bit of
caution here. The temptation to jump back in
may be strong, but when you have a selloff
as powerful as the NDX just had, it is rarely
over this quickly."
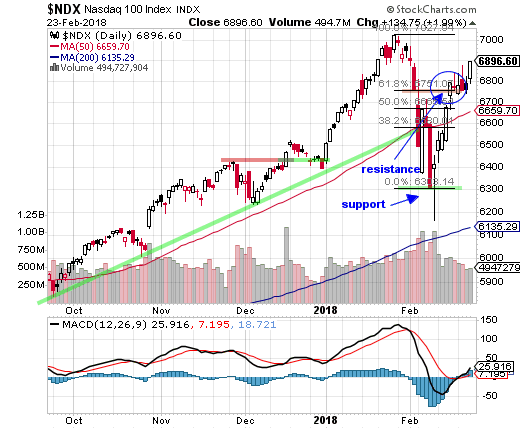
This week:
The Nasdaq 100 Index (NDX) spent most of the
week testing the Fib 61.8% retracement resistance
level. But on Friday the NDX made a decisive
close above this resistance.
That forces this portion of the strategy into
a bullish position effective Monday.
We have our concerns with the correction, worried
it is not over. "V" bottoms are not
typical. Extreme selling usually take weeks if
not months to work through before an advance
can hold.
But we must trade what is actually happening.
While the SPX and RUT remain below their resistance
levels, the NDX has made a bullish breakout.
|
Fibtimer HALF
PRICE Offer!
Get
Our Full Reports
Every Weekend
plus Updates Every Trading Day
These FREE reports are
great, but getting our timing signals daily is
what you need to beat the market!
only
$12.25 monthly for
full year
Bull & Bear
Timer
10 Year Results
Fibtimer Timing + 288.9 % |
3
Year Results
Fibtimer Timing + 59.2 %
|
1
Year Results
Fibtimer Timing + 35.5.%
|
Sleepless
nights as your investments are consumed
by a volatile Wall Street?
Consider Fibtimer's
trend trading services. Our trading
plans are unemotional and are always
invested with the trend, which
ever way it is headed.
Fibtimer's
timing strategies MAKE
MONEY in BOTH advancing & declining
markets. No more sleepless nights.
No more upset stomachs.
We profit year after year after year. In fact, we have been timing
the markets successfully for over 25 years.
Join us and start winning!
We
are currently offering HALF
PRICE to new and returning
subscribers.
--- only
$12.25 monthly for full year
Special
HALF PRICE Offer - CLICK
HERE NOW
|
|
Maybe it really is different this time.
The Fib 61.8% resistance level is where rebounds
typically reverse. For the NDX, the breakthrough
was substantial.
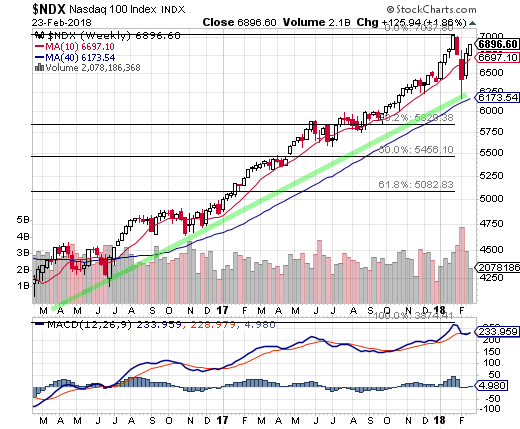
We have posted Fibonacci retracement "support" levels
for the advance from the February 2016 lows. Those
Fib support levels (weekly chart)
are; 38.2% at NDX 5829, 50% at NDX 5455 and 61.8%
at NDX 5081.
Conclusion:
The NDX spent the week right at its 61.8% Fibonacci
resistance level. But on Friday that resistance
was decisively broken. This forces a bullish position
for the NDX.
The NDX portion of this strategy
is BULLISH. Aggressive traders following this strategy
should enter the below fund before the close on
Monday, February 26th.
Nasdaq 100 Index (NDX), Daily Chart
Nasdaq 100 Index (NDX), Weekly Chart
|