S&P
500 Index - SPX (50%
of Portfolio)
Entry
Date |
Signal |
Mutual
Fund
or
Index |
Entry Current
Price Price
Friday Close |
Time
Frame |
Gain
Loss |
Current
Position |
|
| 9/5/17 |
Bullish |
Rydex Nova S&P
Fd |
62.58d
- 79.28 |
9/5 - 2/9 |
+ 14.2 % |
Closed |
|
| 3/31/17 |
Bullish |
Rydex Nova S&P
Fd |
60.14 - 63.78 |
3/31 - 8/22 |
+ 6.1 % |
Closed |
|
| 1/5/17 |
Bullish |
Rydex Nova S&P
Fd |
56.54 - 60.55 |
1/5 - 3/10 |
+ 7.1 % |
Closed |
|
| 9/22/16 |
Bullish |
Rydex
Nova S&P
Fd |
51.67d
- 56.11 |
9/22
- 1/3 |
+
8.7 % |
Closed |
|

S&P 500 Index
(SPX) Chart Analysis
Last week:
"The stock market has been rising
at an unsustainable rate for most of 2017. In January
of 2018 that rise only accelerated. Although there
were reasons for the selling this week, once it started
investors and traders were quick to abandon the bull
market and exit. The S&P 500 Index (SPX) declined
- 3.85% for the full week, still not reaching a five
percent pullback which would be a minimal correction."
This week:
The intra-day lows reached on Monday during the worst
of the selling, were broken on Thursday when stocks
had another major selloff. That was the only obvious
support level that had a chance of holding in the short-term,
and it was decisively broken.
On Friday the markets opened in rally mode, but that
break in support soon weighed in and prices dropped
again, this time to new lows. Yet the volatility was
so great that the losses were erased and the S&P
managed to close with a + 1.49% gain.
That was not the case for the entire week during which
the SPX lost - 5.16%.
At this time, as scary as these declines are, we are
still looking at this as no more than a correction
in a continuing bull market.
The economy is strong and getting stronger. Jobless
numbers are at historical lows and wages are getting
better. There is no reason for a bear market at this
point.
That opinion could change of course, but for now,
even while we are almost 100% in cash positions, we
will be looking for a bottom and a reentry point.
But we do NOT see this as a "V" type correction.
The technical damage is too severe so we expect rallies
and then selling again. Possibly testing the lows and
possibly to lower lows.
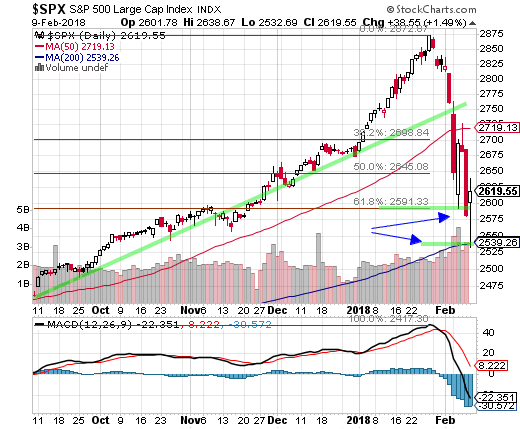
Friday's decline dropped the SPX right to its 200-day
moving average line. That was apparently where many
traders had buy triggers set up because the SPX immediately
rallied.
In the daily chart of the SPX we show two support
levels. The first was at Tuesday's low. It was broken
on Thursday and Friday.
Note that this is also the 61.8% Fibonacci level (daily
chart). Though SPX 2590 was broken to the downside,
that break was fractional on Thursday and on Friday
the SPX reversed and closed higher.
The second is at the 200-day moving average line.
This is at SPX 2540. That level was reached Friday
and the stock market immediately reversed and closed
higher.
Could this be a bottom? Yes, it could. But there has
been so much damage that we are looking for a retest
of that low. If it holds again, we could see an end
to the correction. If not, well then we head lower.
While it’s impossible to say for sure what was
at work when the Dow Jones Industrial Average fell
as much as 1,597 points on Monday, the worst part of
the downdraft felt too many like machines run amok.
For 15 minutes just after 3 p.m. in New York a deluge
of sell orders came so fast that it seemed like nothing
breathing could’ve been responsible.
When something like this happens there is not much
that can be done. Basically just follow your strategies
and try not to panic.
There were two better than 9 to 1 down vs up volume
days in a row this week. Certainly not seen very often
and it was the result of panic selling. Everyone headed
for the exit at the same time.
|
Fibtimer HALF
PRICE Offer!
Get
Our Full Reports
Every Weekend
plus Updates Every Trading Day
These FREE reports
are great, but getting our timing signals daily is
what you need to beat the market!
only
$12.25 monthly for
full year
Bull & Bear
Timer
10 Year Results
Fibtimer Timing + 288.9 % |
3
Year Results
Fibtimer Timing + 59.2 %
|
1
Year Results
Fibtimer Timing + 35.5.%
|
Sleepless
nights as your investments are
consumed by a volatile Wall Street?
Consider Fibtimer's
trend trading services. Our trading
plans are unemotional and are always
invested with the trend,
which ever way it is headed.
Fibtimer's
timing strategies MAKE
MONEY in BOTH advancing & declining
markets. No more sleepless nights.
No more upset stomachs.
We profit year after year after year. In fact, we have been timing
the markets successfully for over 25 years.
Join us and start winning!
We
are currently offering HALF
PRICE to new and returning
subscribers.
--- only
$12.25 monthly for full year
Special
HALF PRICE Offer - CLICK
HERE NOW
|
|
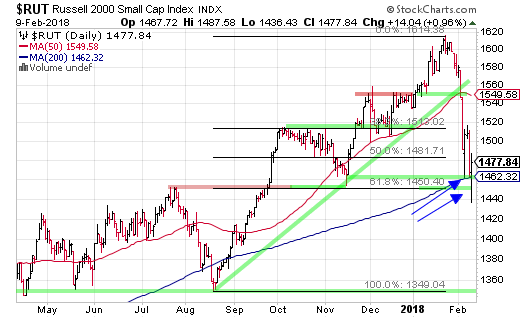
Small caps, already the weakest of the
major indexes we follow, triggered a
go-to-cash signal on Monday (executed
Tuesday).
There are two support levels for small
caps. At RUT 1462 and then at RUT 1440.
Both were hit this week but small caps
rebounded, closing the week at RUT 1477.
This has the look of a reversal at a
bottom. But it is far too soon to take
any chance at reentry.
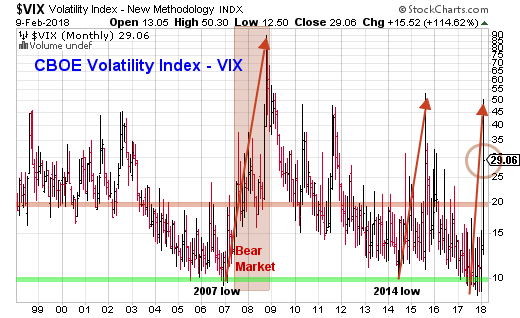
During extreme volatility on Monday,
the CBOE Volatility Index (VIX) rose
to just above 50.0.
We have been calling for this move for
months, but certainly did not expect
it to occur in a single week. The VIX
is up + 114% in February. At its highs,
VIX was up over +300%.
Note that VIX extremes in the past resulted
in market bottoms. So the VIX chart could
be very good news.
Regularly
Followed Weekly Charts
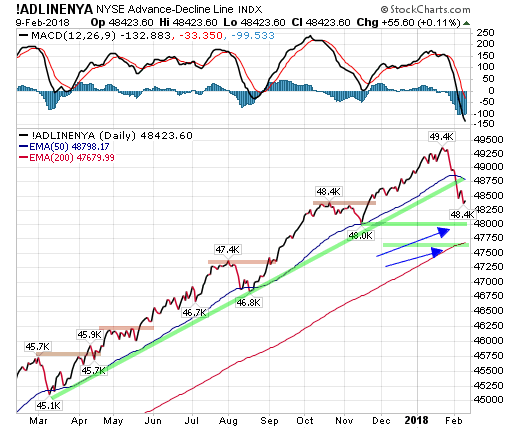
NYSE Advance-Decline
Line
The NYSE Advance-Decline line took a
steep drop this week. The selling took
the A-D line down to well below its rising
trend support line.
The A-D line also closed below its 50-day
moving average line and MACD has turned
decisively lower.
We have two potential support levels
on the below chart.
The first is at the November 2017 lows
and the second at the 200-day moving
average line.
Either could stop the freefall, or we
could be at a bottom now after several
of the major indexes hit their 200-day
averages and then rebounded.
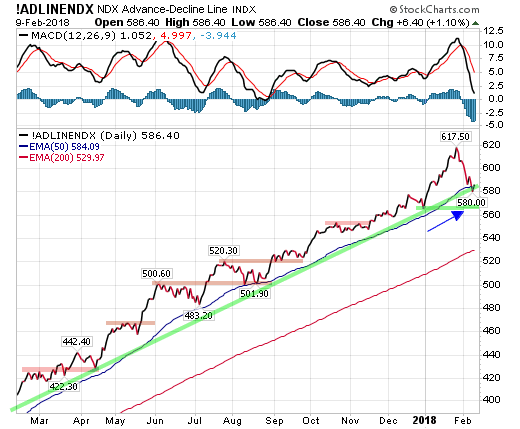
The Nasdaq 100 Index Advance-Decline
Line decline hit its rising trend support
line this week. That line is also at
the same level as its 50-day moving average.
The A-D line is at very strong support
levels. If they hold it would add weight
to a bottom occurring at this point.
If we go lower, the next support is
down at the December 2017 lows.
MACD has suffered a bearish crossover.
CBOE Volatility
Index (VIX).
The CBOE Volatility Index (VIX) closed
at 29.06% on Friday. This was a 68% gain
for the week as traders began buying
more insurance against further declines.
We covered this chart in the above report.
The gains are so extreme, over 50.0 at
the highs, it could be indicating a bottom
is at hand or is very close.
|
Fibtimer HALF
PRICE Offer!
Get
Our Full Reports
Every Weekend
plus Updates
Every Trading
Day
These
FREE reports are NOT enough
Receive our reports in Real-Time!
only
$12.25 monthly
Available
this Weekend
Bull & Bear
Timer
10 Year Results
Fibtimer Timing + 288.9 % |
3
Year Results
Fibtimer Timing + 59.2 %
|
1
Year Results
Fibtimer Timing + 35.5.%
|
Sleepless
nights as your
investments are
consumed by a volatile
Wall Street?
Consider Fibtimer's
trend trading services.
Our trading plans
are unemotional
and are always
invested with the
trend, which ever
way it is headed.
Fibtimer's
timing strategies MAKE
MONEY in
BOTH advancing & declining
markets. No more
sleepless nights.
No more upset
stomachs.
We profit year after year after year. In fact, we have been timing the markets
successfully for over 25 years.
Join us and start
winning!
We
are currently offering HALF
PRICE to
new subscribers.
---
Available ONLY This
Weekend - only
$12.25 monthly
Special
HALF PRICE Offer - CLICK
HERE NOW
|
|
We extended this chart to a twenty
year time-frame to show what has occurred
every time VIX reached the 10.0 level.
A VIX 10.0 is considered by many to
be contrarian bearish, but VIX can
stay contrarian bearish for a while
once a strong rally is started.
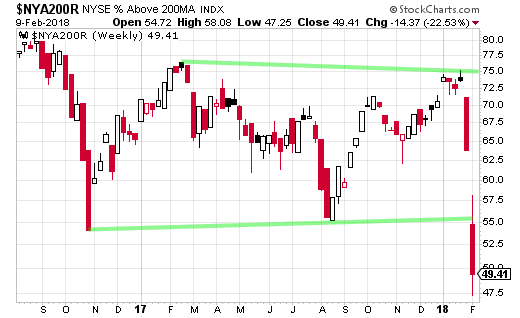
Market Internals
As would be expected
considering the selloff, the number
of NYSE stocks above their 200-day
moving averages declined precipitously
From 75% of stocks above
their 200-day average two weeks ago
to only 49% now.
Sentiment Indicators
These are contrarian
indicators. Typically, when advisors
are mostly bullish, the markets are
near a top.
Note that these numbers
are from a week ago. They reflect
the preceding week's sentiment.
The
number of bulls remains high. Remember
that those who are neither bullish
nor bearish have bullish positions
and really should be considered bullish.
Add bulls and those not specifically
bearish and you get 84.5%
with at least some bullish market positions.
Investor's
Intelligence Bull vs. Bears as
of Jan 30, show 54.4%
bullish vs. 15.5% bearish.
Bull vs. Bears last week were 66.0%
bullish vs. 12.6% bearish.
** as these
numbers are a week old, we will be looking
for a much higher percent of bears when
next reported.
-
Barron's Magazine
Consensus Index shows 73% bullish
vs. 77% bullish the previous
week.
-
Market
Vane's Bullish Consensus
shows 64% are bullish
vs. 70% bullish the
week before.
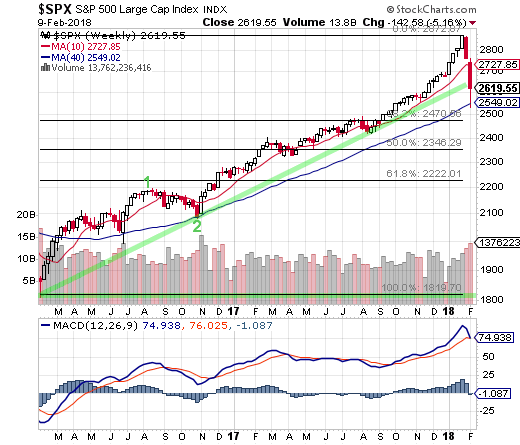
Fibonacci Support
/ Resistance Levels
We are now looking at "support
levels" from the correction lows.
Fib support levels on the weekly chart
are as follows; the 38.2% retracement
support at 2470, the 50% retracement
support at 2346 and the critical 61.8%
retracement support at 2222.
Market Moving
Economic Reports Released this Week:
Growth in the services PMI held at
a moderate 53.3 in the final reading
for January, a 9-month low and unchanged
from the mid-month flash and down 4
tenths from December.
The U.S. trade deficit in December
and for the full year both rose to
the highest levels since 2008, complicating
efforts by President Trump to fulfill
his vow to reduce the gap. The deficit
in December rose 5.3% to $53.1 billion,
the Commerce Department said Tuesday.
Consumer borrowing increased in December,
up $18.4 billion vs an upwardly revised
$31.0 billion in November which is
the largest monthly increase since
a break in the series 7 years ago.
Revolving credit, a component that
tracks credit-card debt, rose a sizable
$5.1 billion following a November spike
of $11.0 billion. On an annualized
basis, revolving credit rose at a 6.0
percent pace in December.
|
Fibtimer HALF
PRICE Offer!
Get
Our Full Reports
Every Weekend
plus Updates
Every Trading
Day
These
FREE reports are NOT enough
Receive our reports in Real-Time!
only
$12.25 monthly
Available
this Weekend
Bull & Bear
Timer
10 Year Results
Fibtimer Timing + 288.9 % |
3
Year Results
Fibtimer Timing + 59.2 %
|
1
Year Results
Fibtimer Timing + 35.5.%
|
Sleepless
nights as your
investments are
consumed by a volatile
Wall Street?
Consider Fibtimer's
trend trading services.
Our trading plans
are unemotional
and are always
invested with the
trend, which ever
way it is headed.
Fibtimer's
timing strategies MAKE
MONEY in
BOTH advancing & declining
markets. No more
sleepless nights.
No more upset
stomachs.
We profit year after year after year. In fact, we have been timing
the markets successfully for over 25 years.
Join us and start winning!
We
are currently offering HALF
PRICE to
new subscribers.
---
Available ONLY This
Weekend - only
$12.25 monthly
Special
HALF PRICE Offer - CLICK
HERE NOW
|
|
Initial U.S. jobless claims fell by
9,000 to 221,000 in the seven days
ended Feb 3. Economists surveyed by
MarketWatch forecast a 235,000 reading.
The more stable monthly average of
claims declined by 10,000 to 224,500,
the government said Thursday. That’s
the lowest level since March 1973.
Moody's Threatens US Downgrade Due
To Soaring Debt, Fiscal Deterioration. "The
stable credit profile of the United
States (Aaa stable) is likely to face
downward pressure in the long-term,
due to meaningful fiscal deterioration
amid increasing levels of national
debt and a widening federal budget
deficit"
Conclusion:
The SPX traded in wild swings this
week as computers took the major indexes
for a ride. Extreme ups and downs in
the range of 1000 Dow points were every
day events.
This strategy went to cash on Tuesday,
a rally day, but we could already have
reached a correction bottom at SPX
2540 as discussed in the above report.
We will find out next week.
The SPX portion of this
strategy is BEARISH. Aggressive traders
should be in CASH (money market funds).
S&P 500 Index (SPX) Daily Chart
S&P 500 Index (SPX), Weekly Chart
Nasdaq 100 Index (NDX) Chart Analysis
Last week we wrote:
"This long-term chart
does not look as bad as the week felt. Looking
with a long term view we would have to say
that yes it was a bad week, but the uptrend
has not been broken. When you have strong gains
in the first days of the New Year it usually
means you will have a positive year ahead"
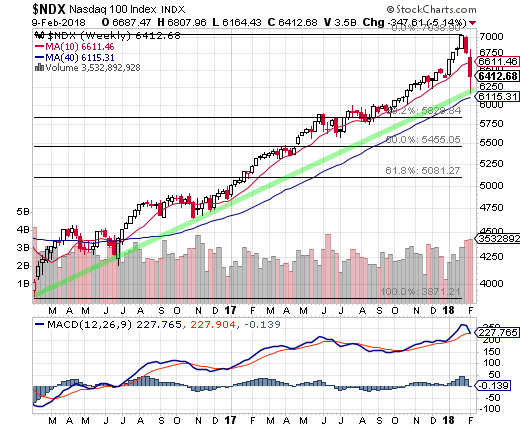
This week:
On the weekly chart below, the Nasdaq 100 Index
(NDX) only just touched its long-term (2 years)
rising trend support line before reversing higher
on Friday.
That one chart could be showing us that a bottom
has been reached.
But considering the volatility, the risk is
far too high at this point for any bullish entry.
Four percent swings happening in minutes is too
risky for us.
The 200-day moving average line has not yet
been reached.
|
Fibtimer HALF
PRICE Offer!
Get
Our Full Reports
Every Weekend
plus Updates Every Trading Day
These FREE reports are
great, but getting our timing signals daily is
what you need to beat the market!
only
$12.25 monthly for
full year
Bull & Bear
Timer
10 Year Results
Fibtimer Timing + 288.9 % |
3
Year Results
Fibtimer Timing + 59.2 %
|
1
Year Results
Fibtimer Timing + 35.5.%
|
Sleepless
nights as your investments are consumed
by a volatile Wall Street?
Consider Fibtimer's
trend trading services. Our trading
plans are unemotional and are always
invested with the trend, which
ever way it is headed.
Fibtimer's
timing strategies MAKE
MONEY in BOTH advancing & declining
markets. No more sleepless nights.
No more upset stomachs.
We profit year after year after year. In fact, we have been timing
the markets successfully for over 25 years.
Join us and start winning!
We
are currently offering HALF
PRICE to new and returning
subscribers.
--- only
$12.25 monthly for full year
Special
HALF PRICE Offer - CLICK
HERE NOW
|
|
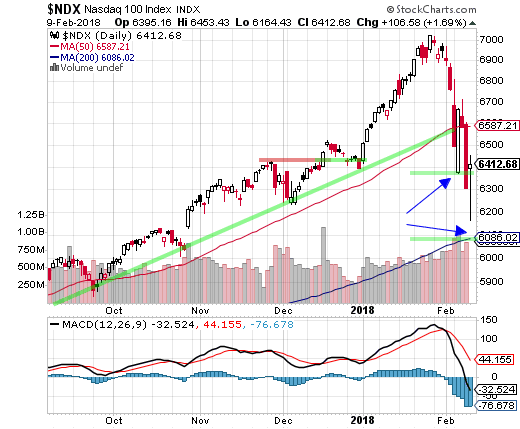
In the daily chart we have two support levels
drawn. The first is at about NDX 6370. That support
was broken intra-day on Friday but has apparently
held after the NDX rebounded.
The second is at the 200-day moving average line,
around NDX 6086.
Remember that a rally early next week could be
followed by another major selloff. It is not safe
to bet on the bullish side yet.
MACD on the daily chart has posted a bearish crossover.
MACD closed this week at -32.52. A huge one-week
decline.
MACD on the less volatile weekly chart of the
NDX closed at + 227.76.
We have posted Fibonacci retracement "support" levels
for the advance from the February 2016 lows. Those
Fib support levels (weekly chart)
are; 38.2% at NDX 5829, 50% at NDX 5455 and 61.8%
at NDX 5081.
Conclusion:
As we wrote last week, the NDX had risen during
the first four weeks of 2018 and had done so in
a nearly parabolic fashion.
That resulted in the parabolic selloff we just
endured.
For those who think such a selloff could be timed,
remember that if there were clues to this selloff,
it would just have occurred earlier.
Also, if knowing this was going to eventually
happen kept us in cash over past months that would
have just killed any chance of the gains we did
realize.
The NDX portion of this strategy
is BEARISH. Aggressive traders should be in CASH
(money market funds).
Nasdaq 100 Index (NDX), Daily Chart
Nasdaq 100 Index (NDX), Weekly Chart
|